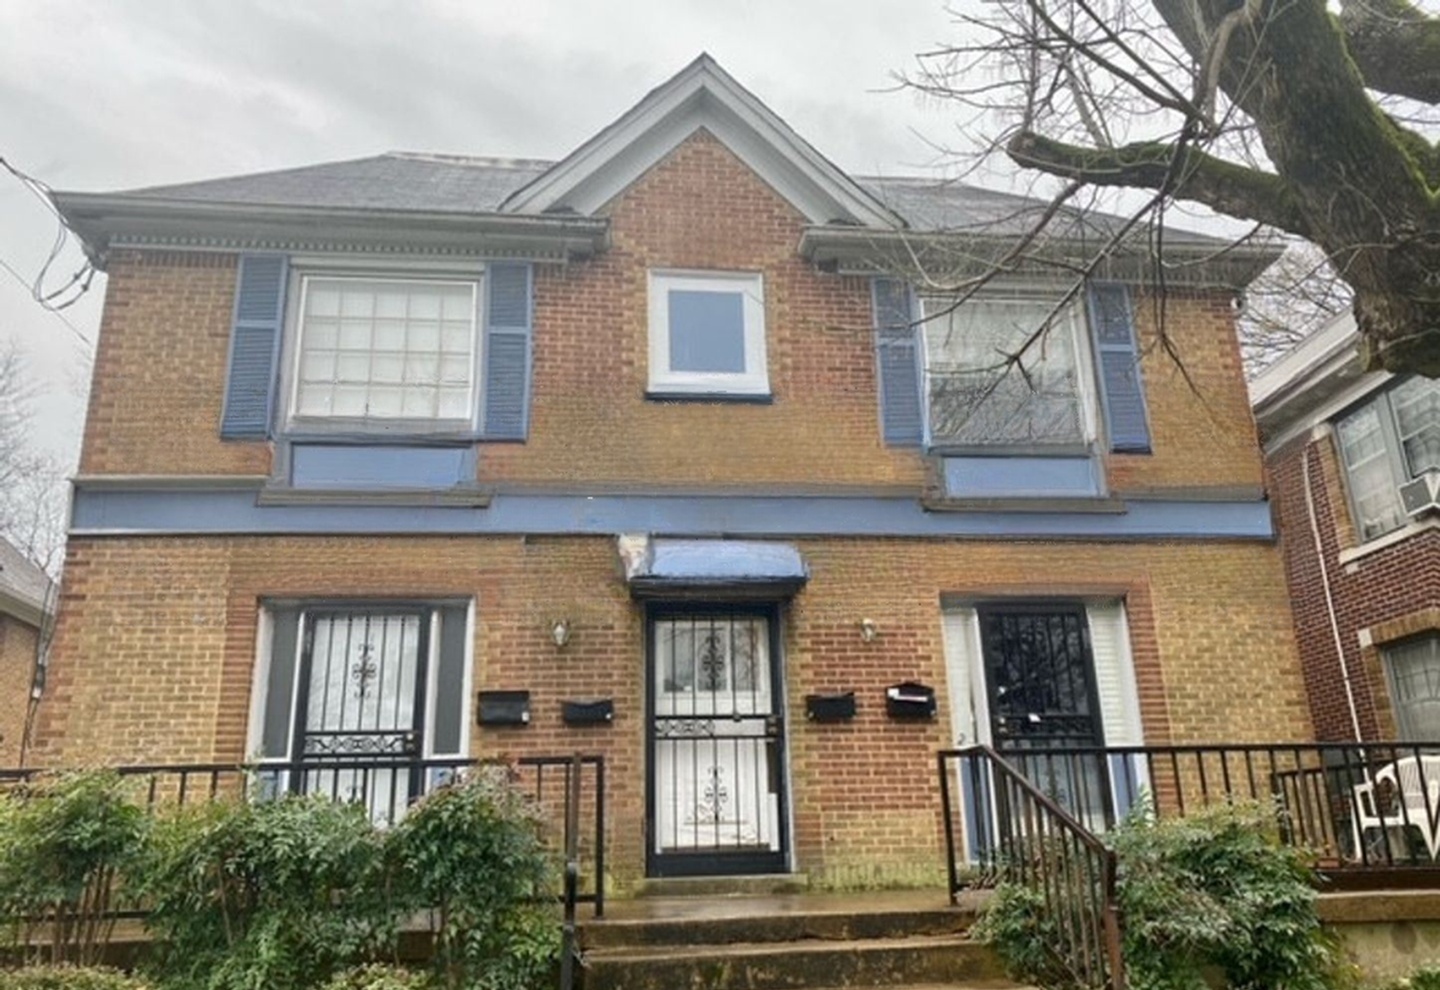
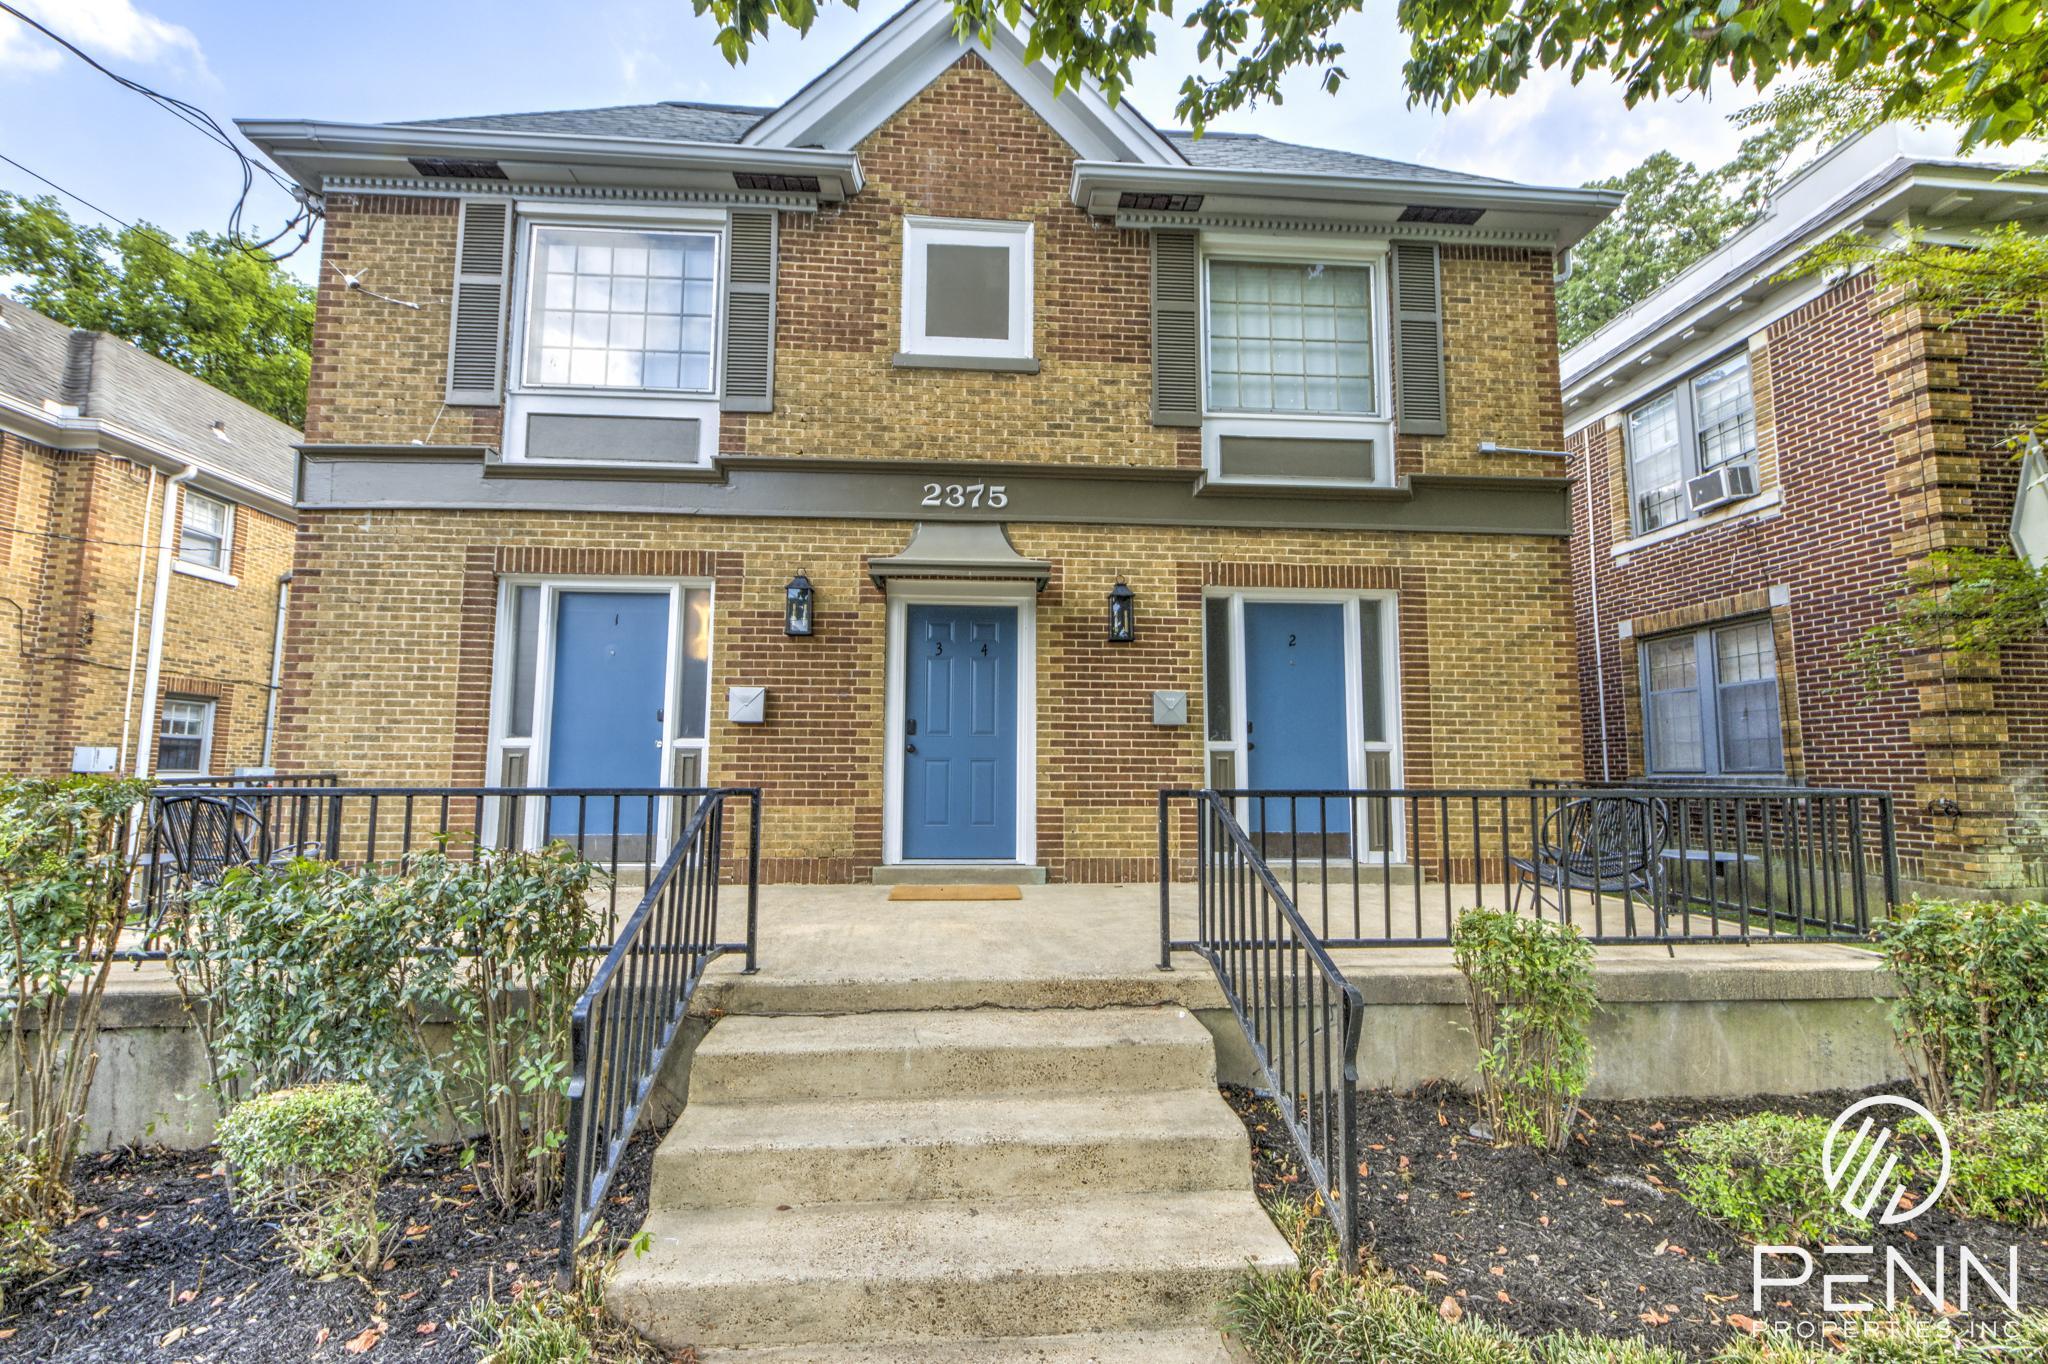
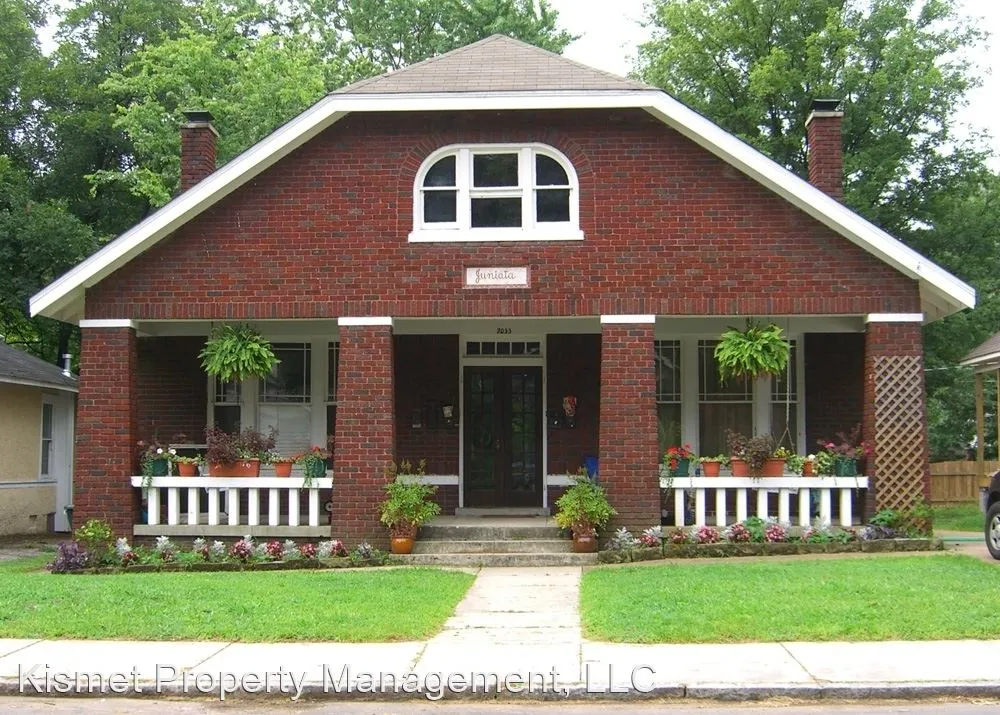
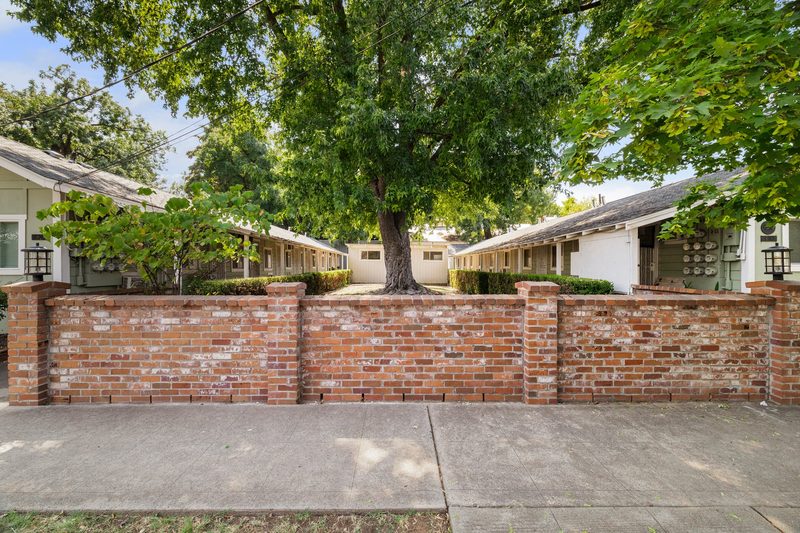
Cherry St Apartments
Chico, CA Units 20
Acquired 2025
Rent at Closing $13,760/mo
Rent Today $16,200/mo
Portfolio Rent Lift +18%
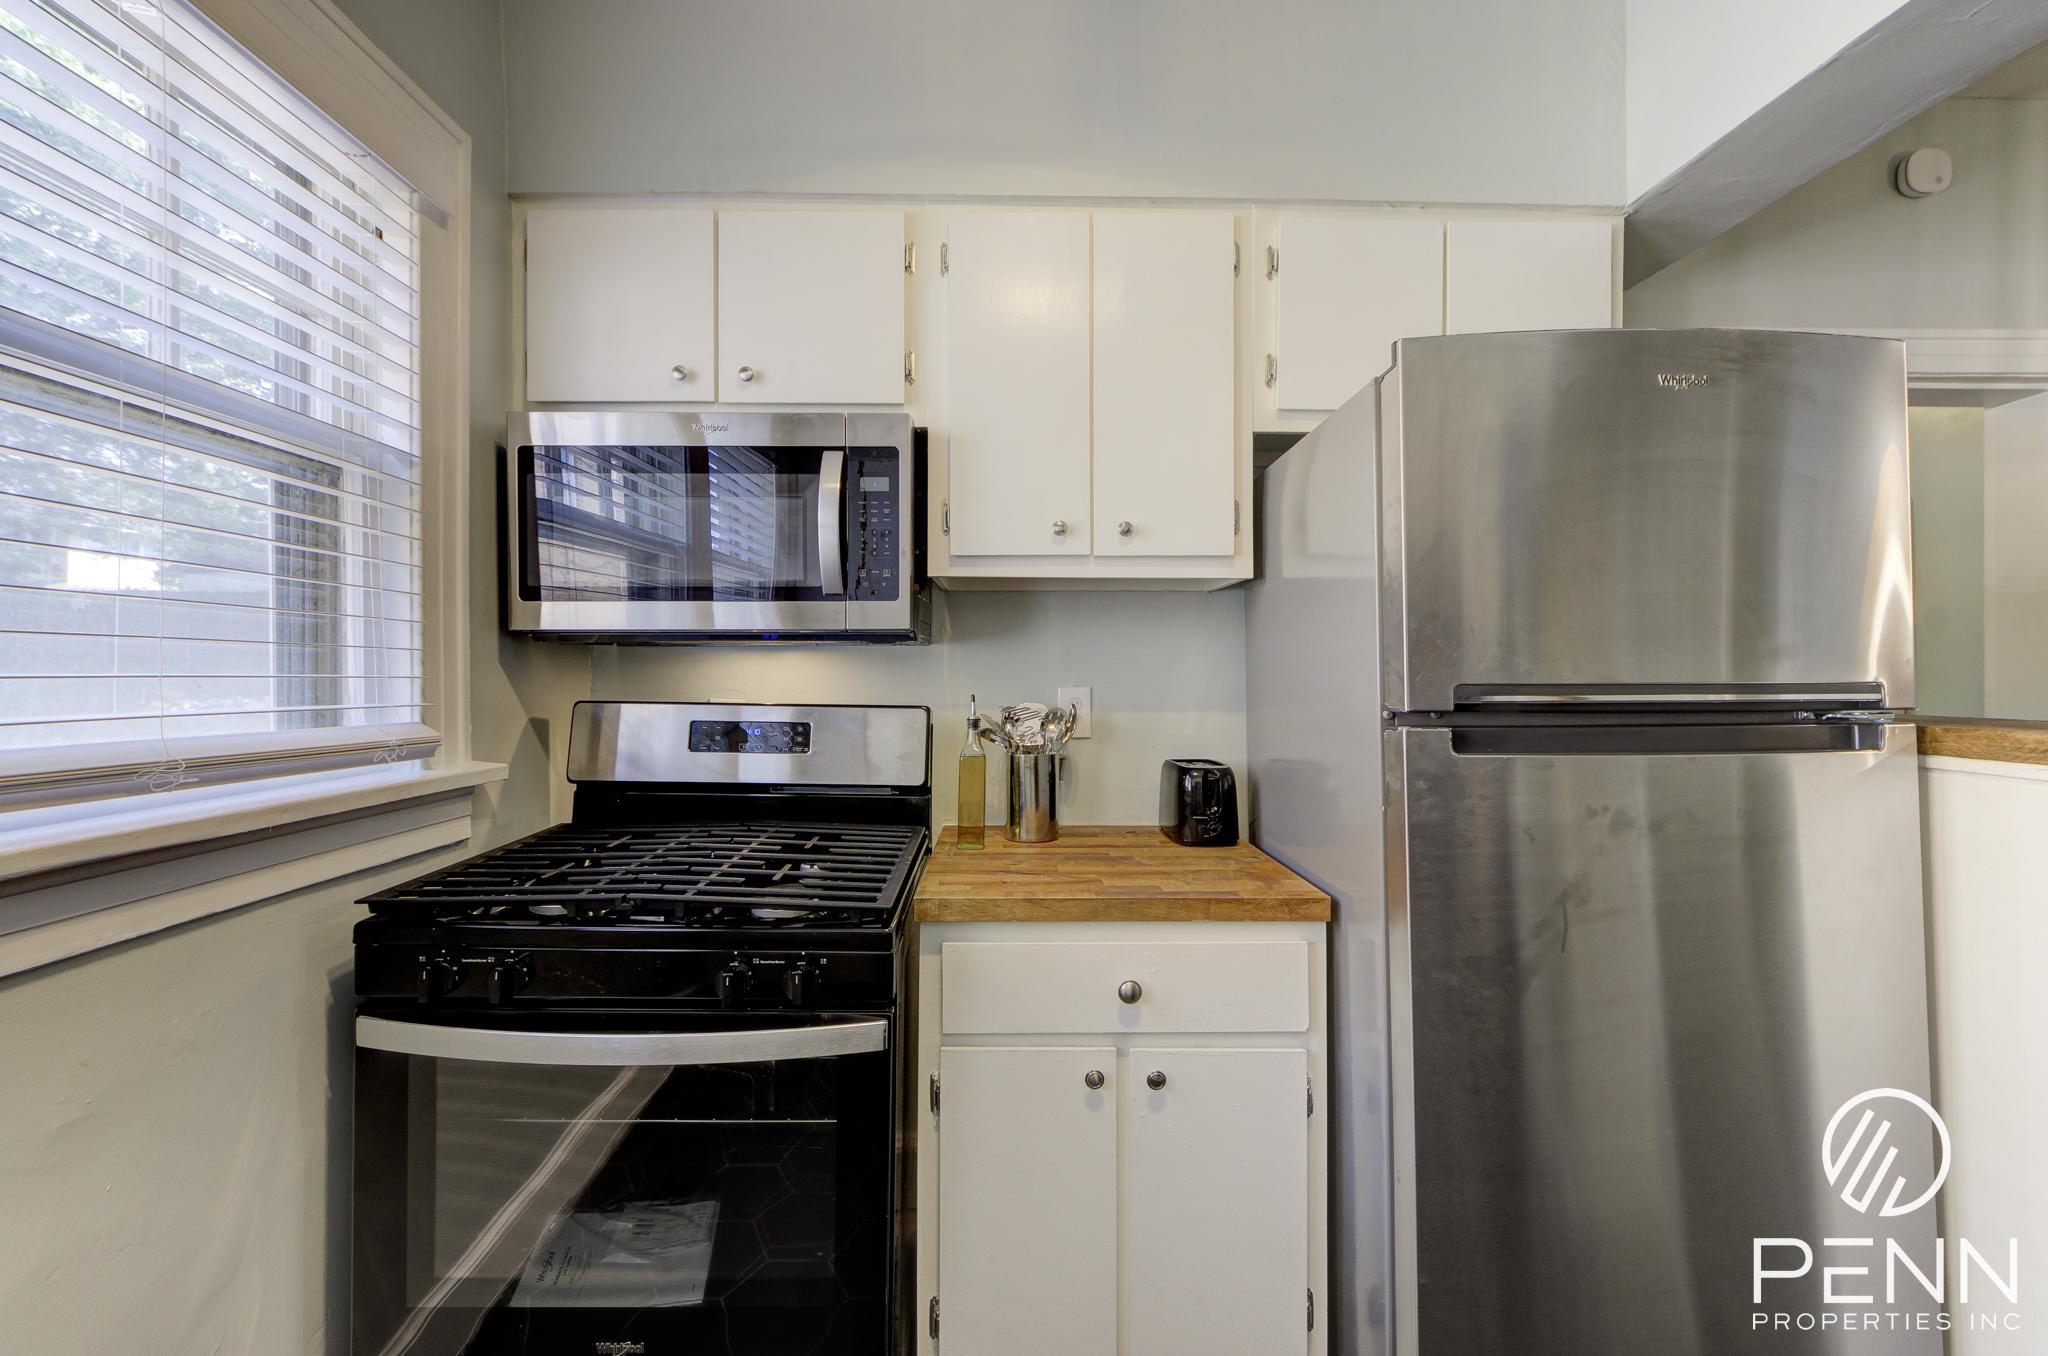
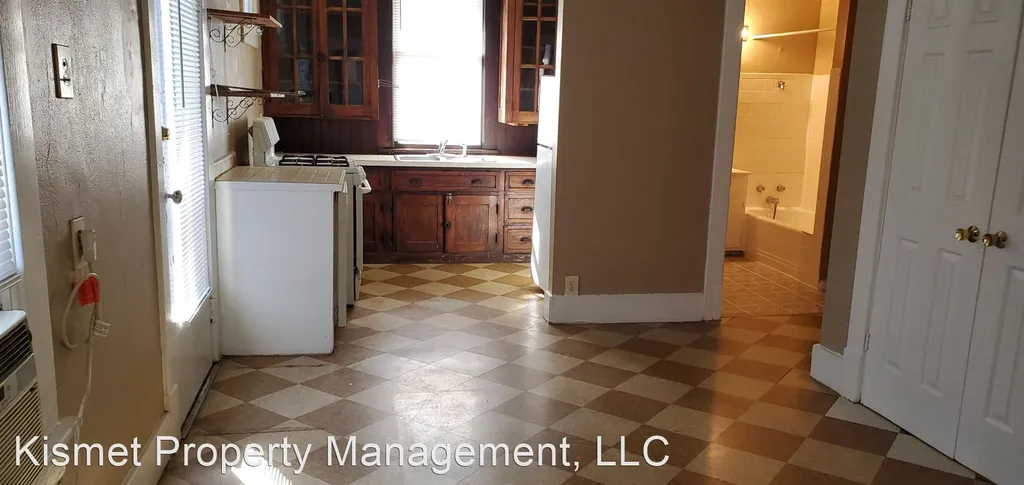
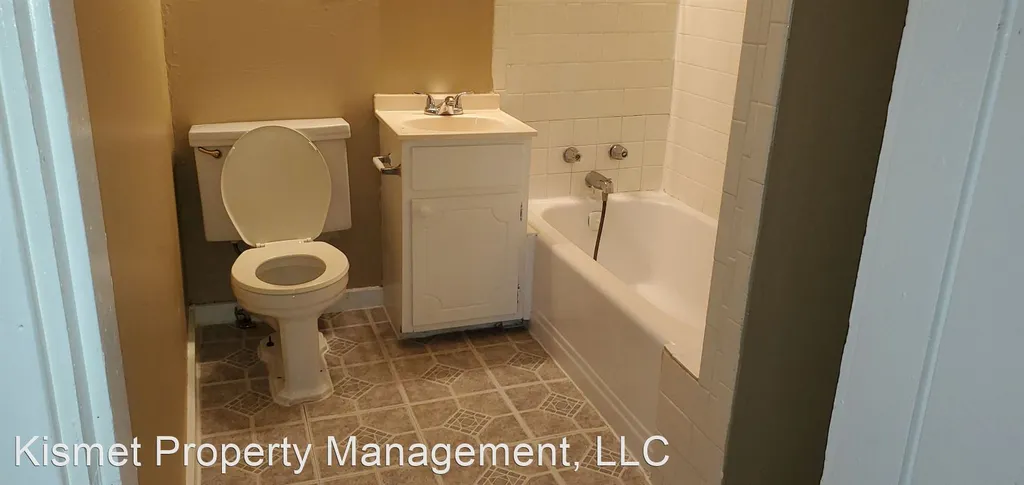
Rehabbed Unit Rent $725 → $1,250
Distribution Quarterly
Current Yield 5% Annual
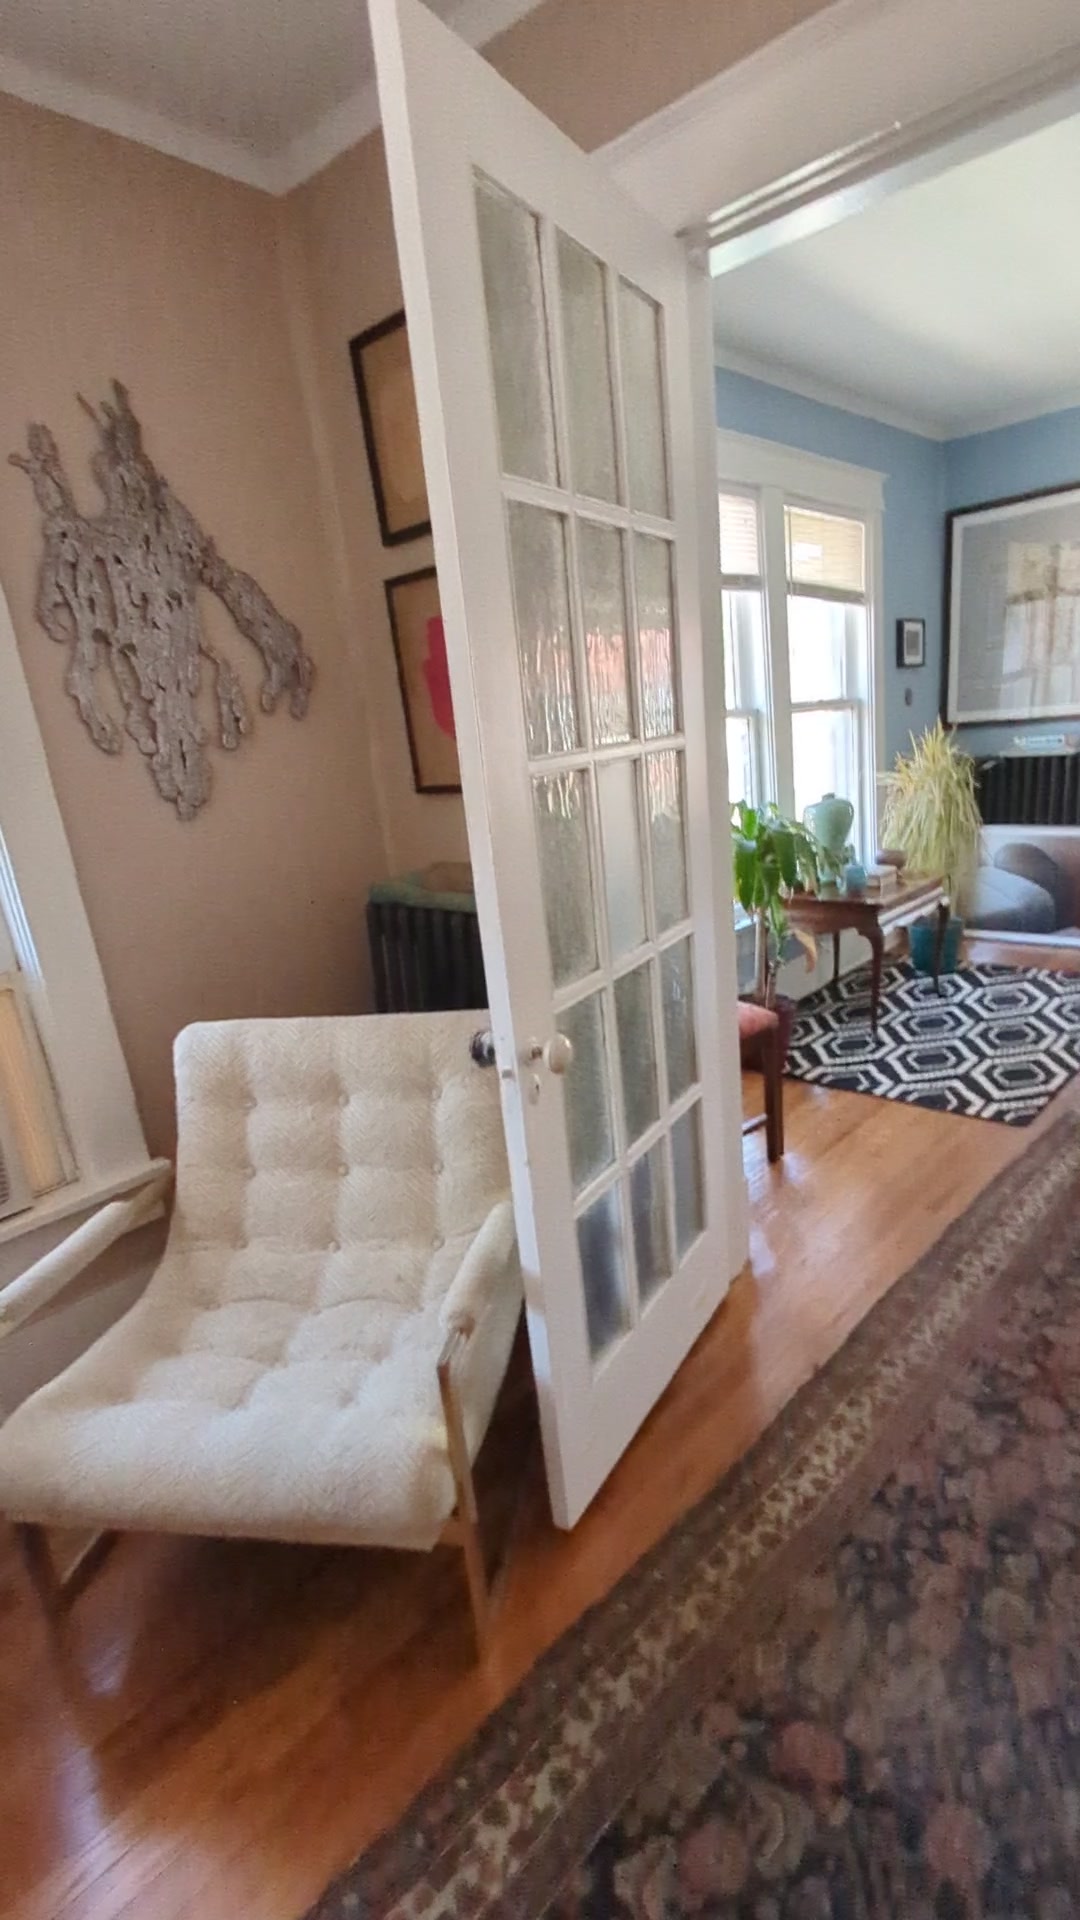
20-unit workforce housing community in Chico, CA. A portion of the units are undergoing full gut rehabs, repositioning them from $725/mo to $1,250/mo. The remaining units are being brought to market rents through operational improvements: normalizing leases, implementing RUBS for utility cost recovery, and maintaining high occupancy through active leasing.
The long-term strategy is to build equity through cashflow and forced appreciation, positioning the asset for a 1031 exchange into a larger property - chasing more cashflow while capturing the upside from repositioning.
Investors receive regular updates on leasing activity, rent collections, maintenance, and operational priorities.
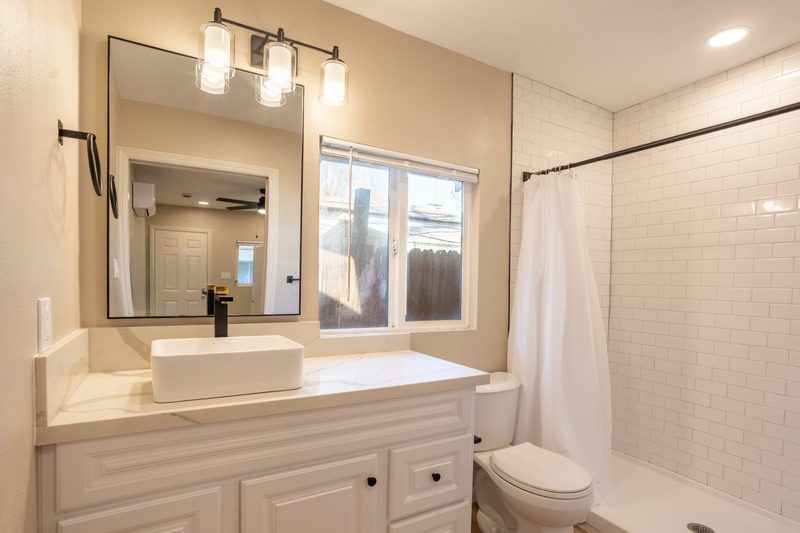
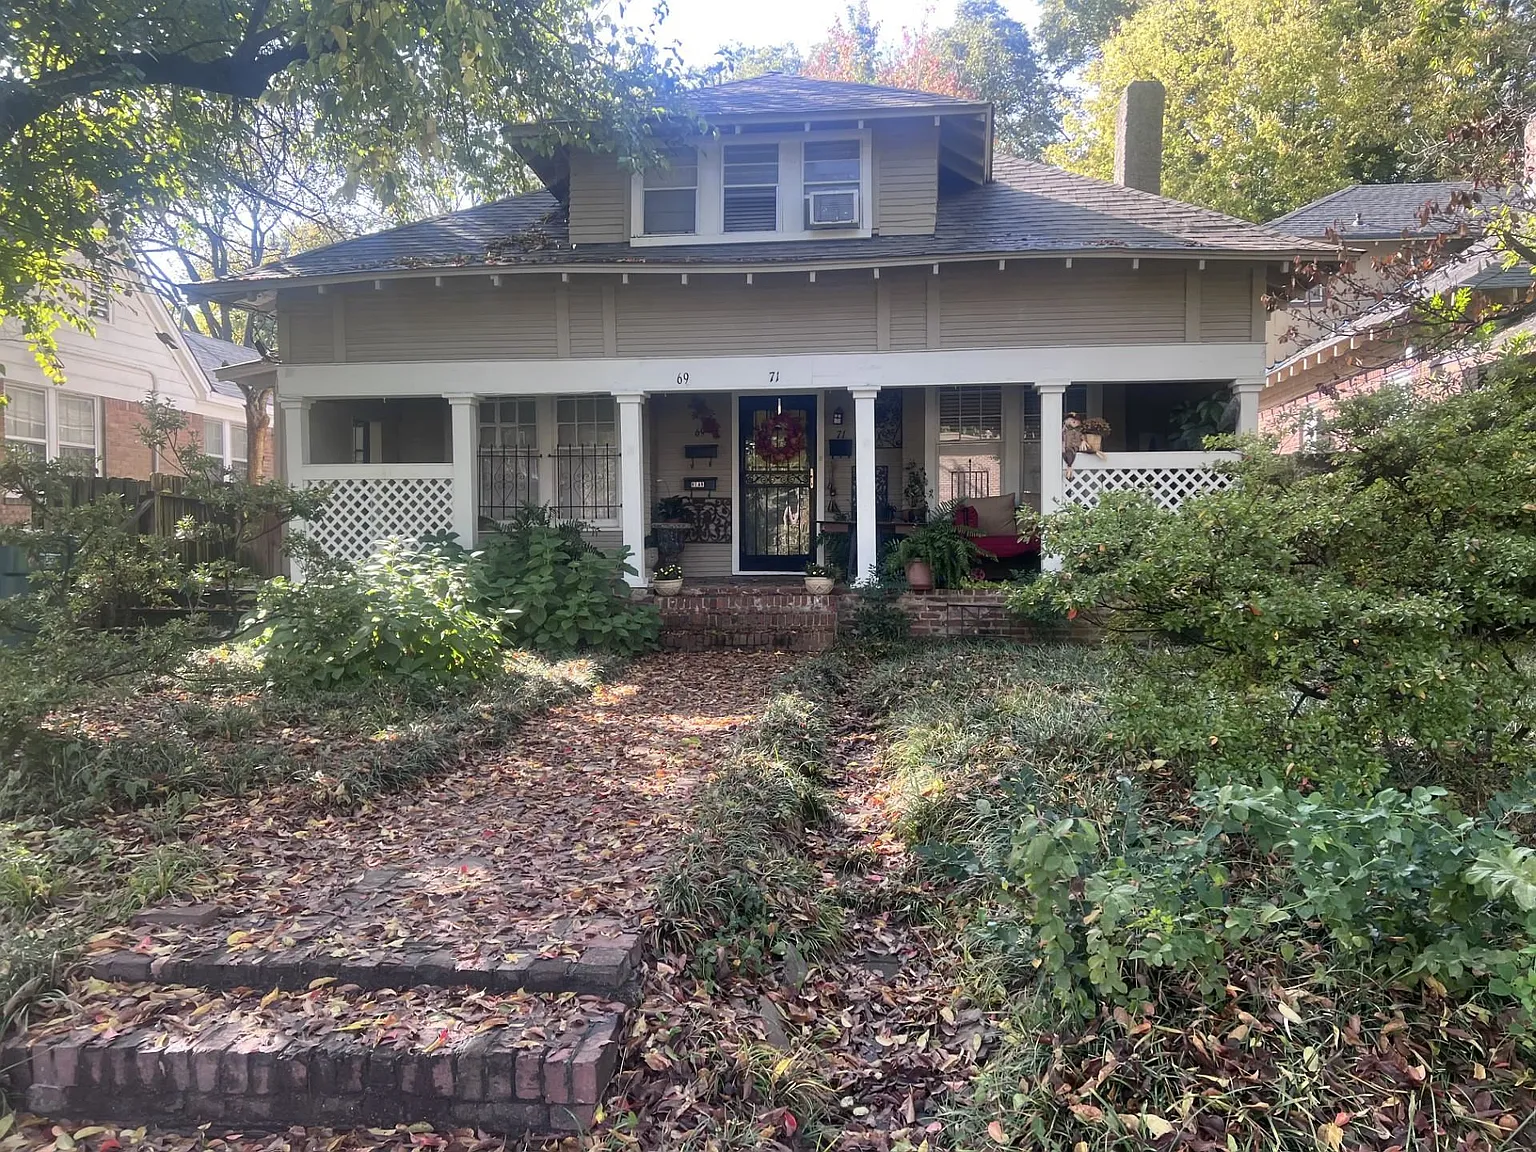
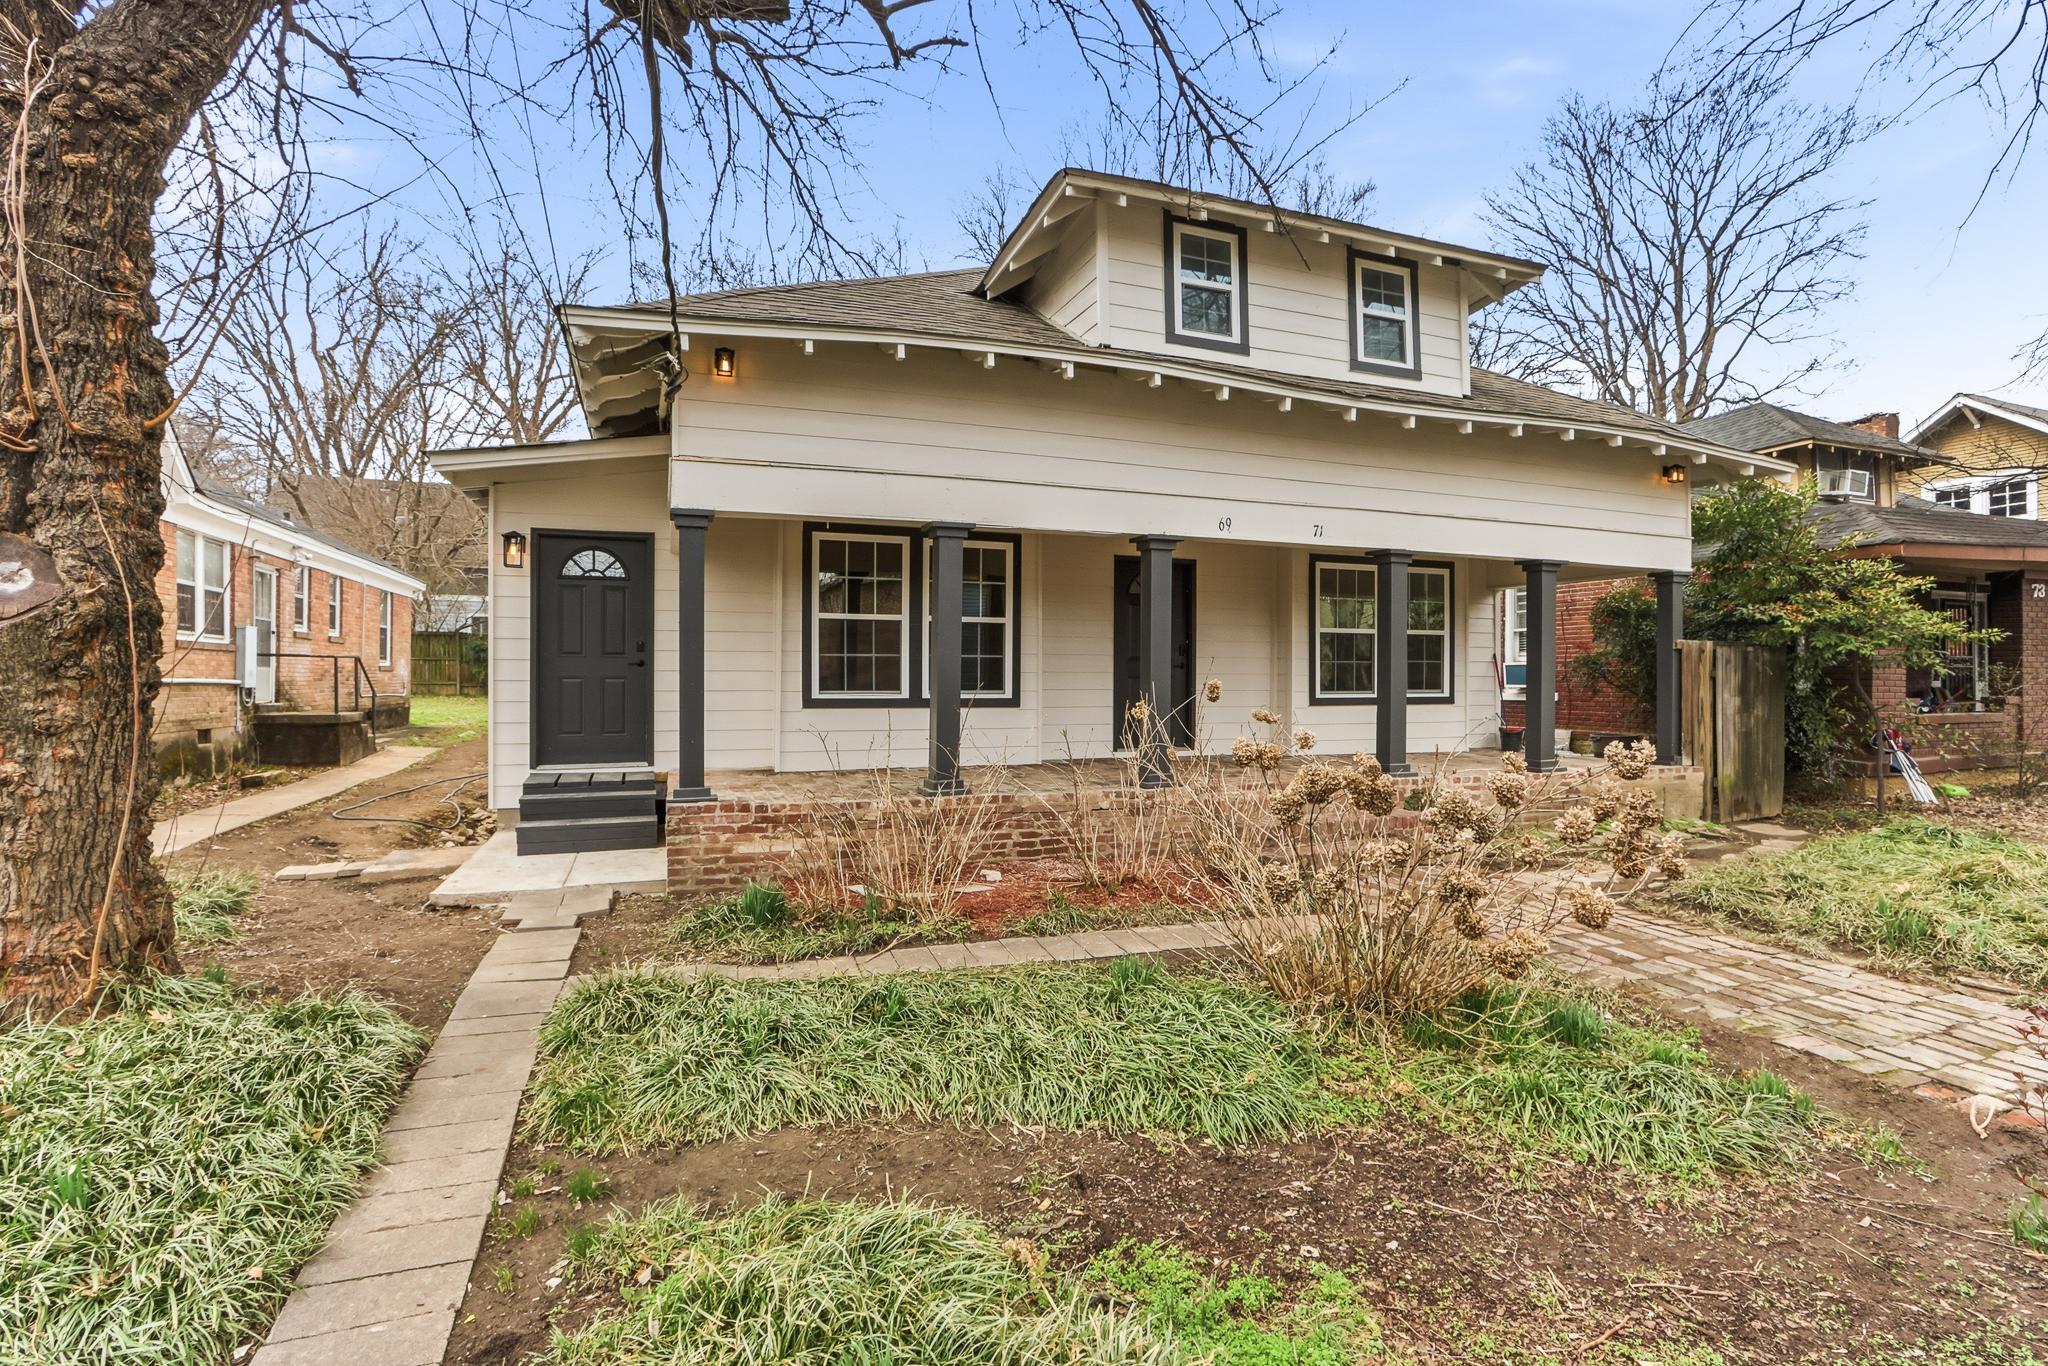
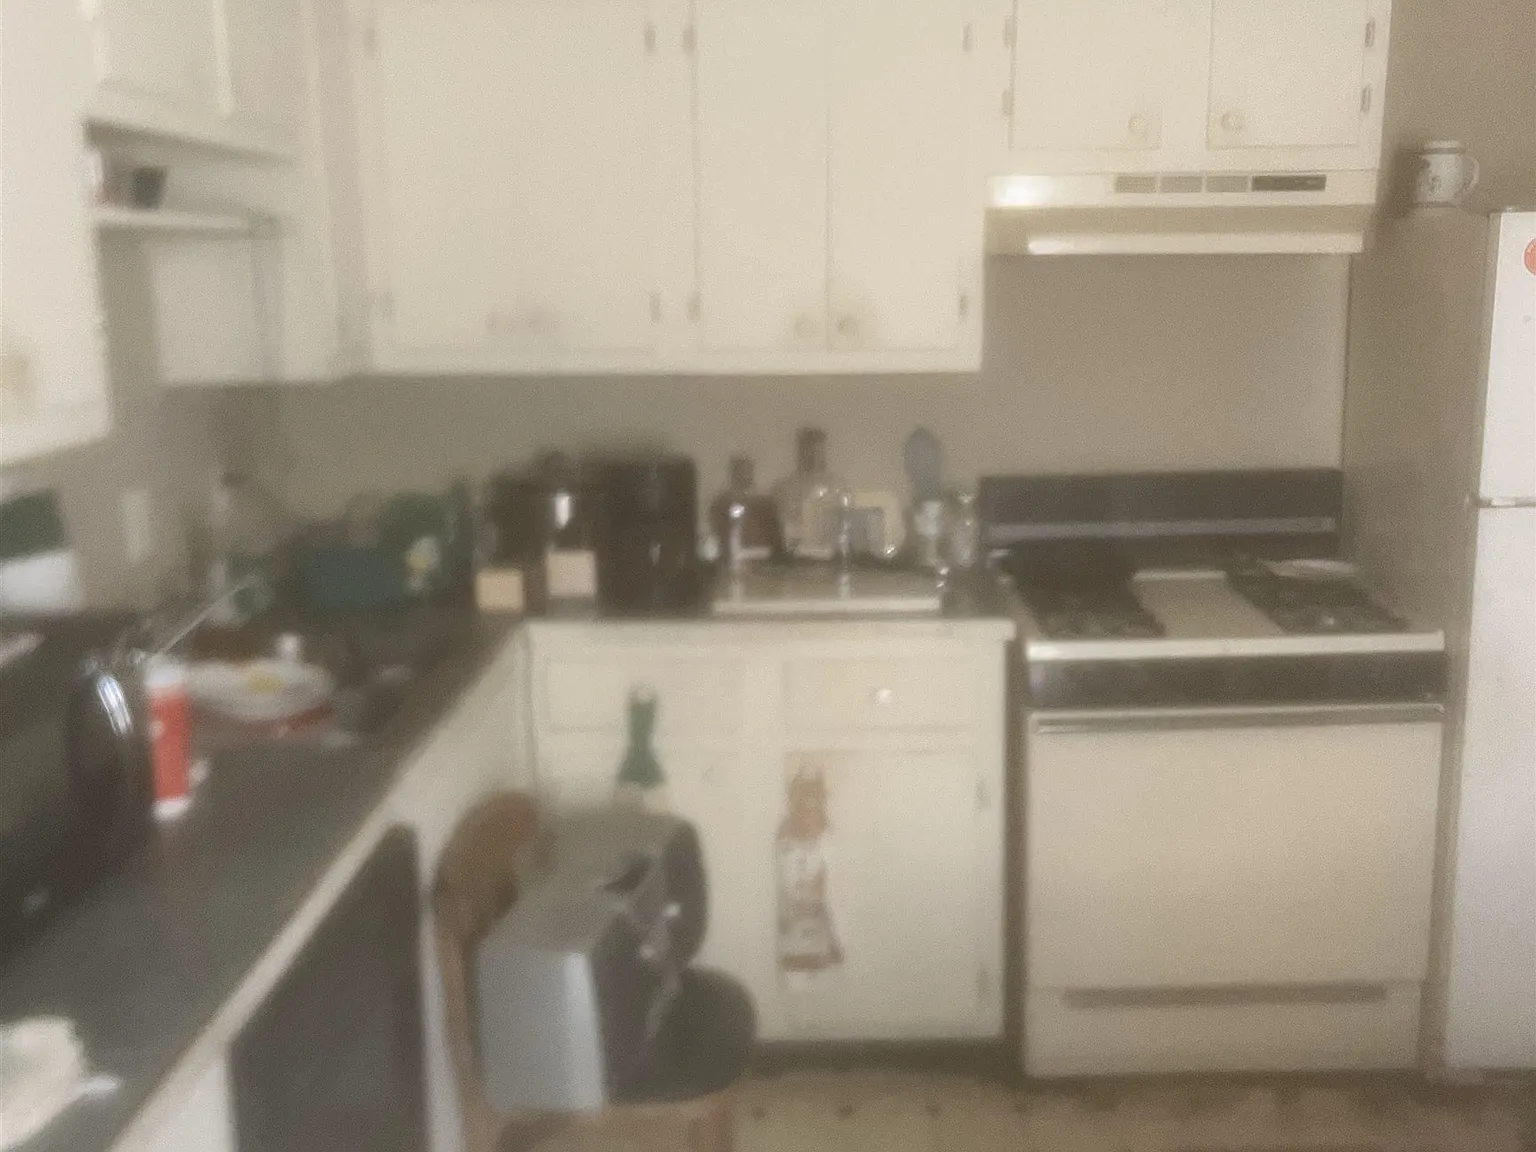
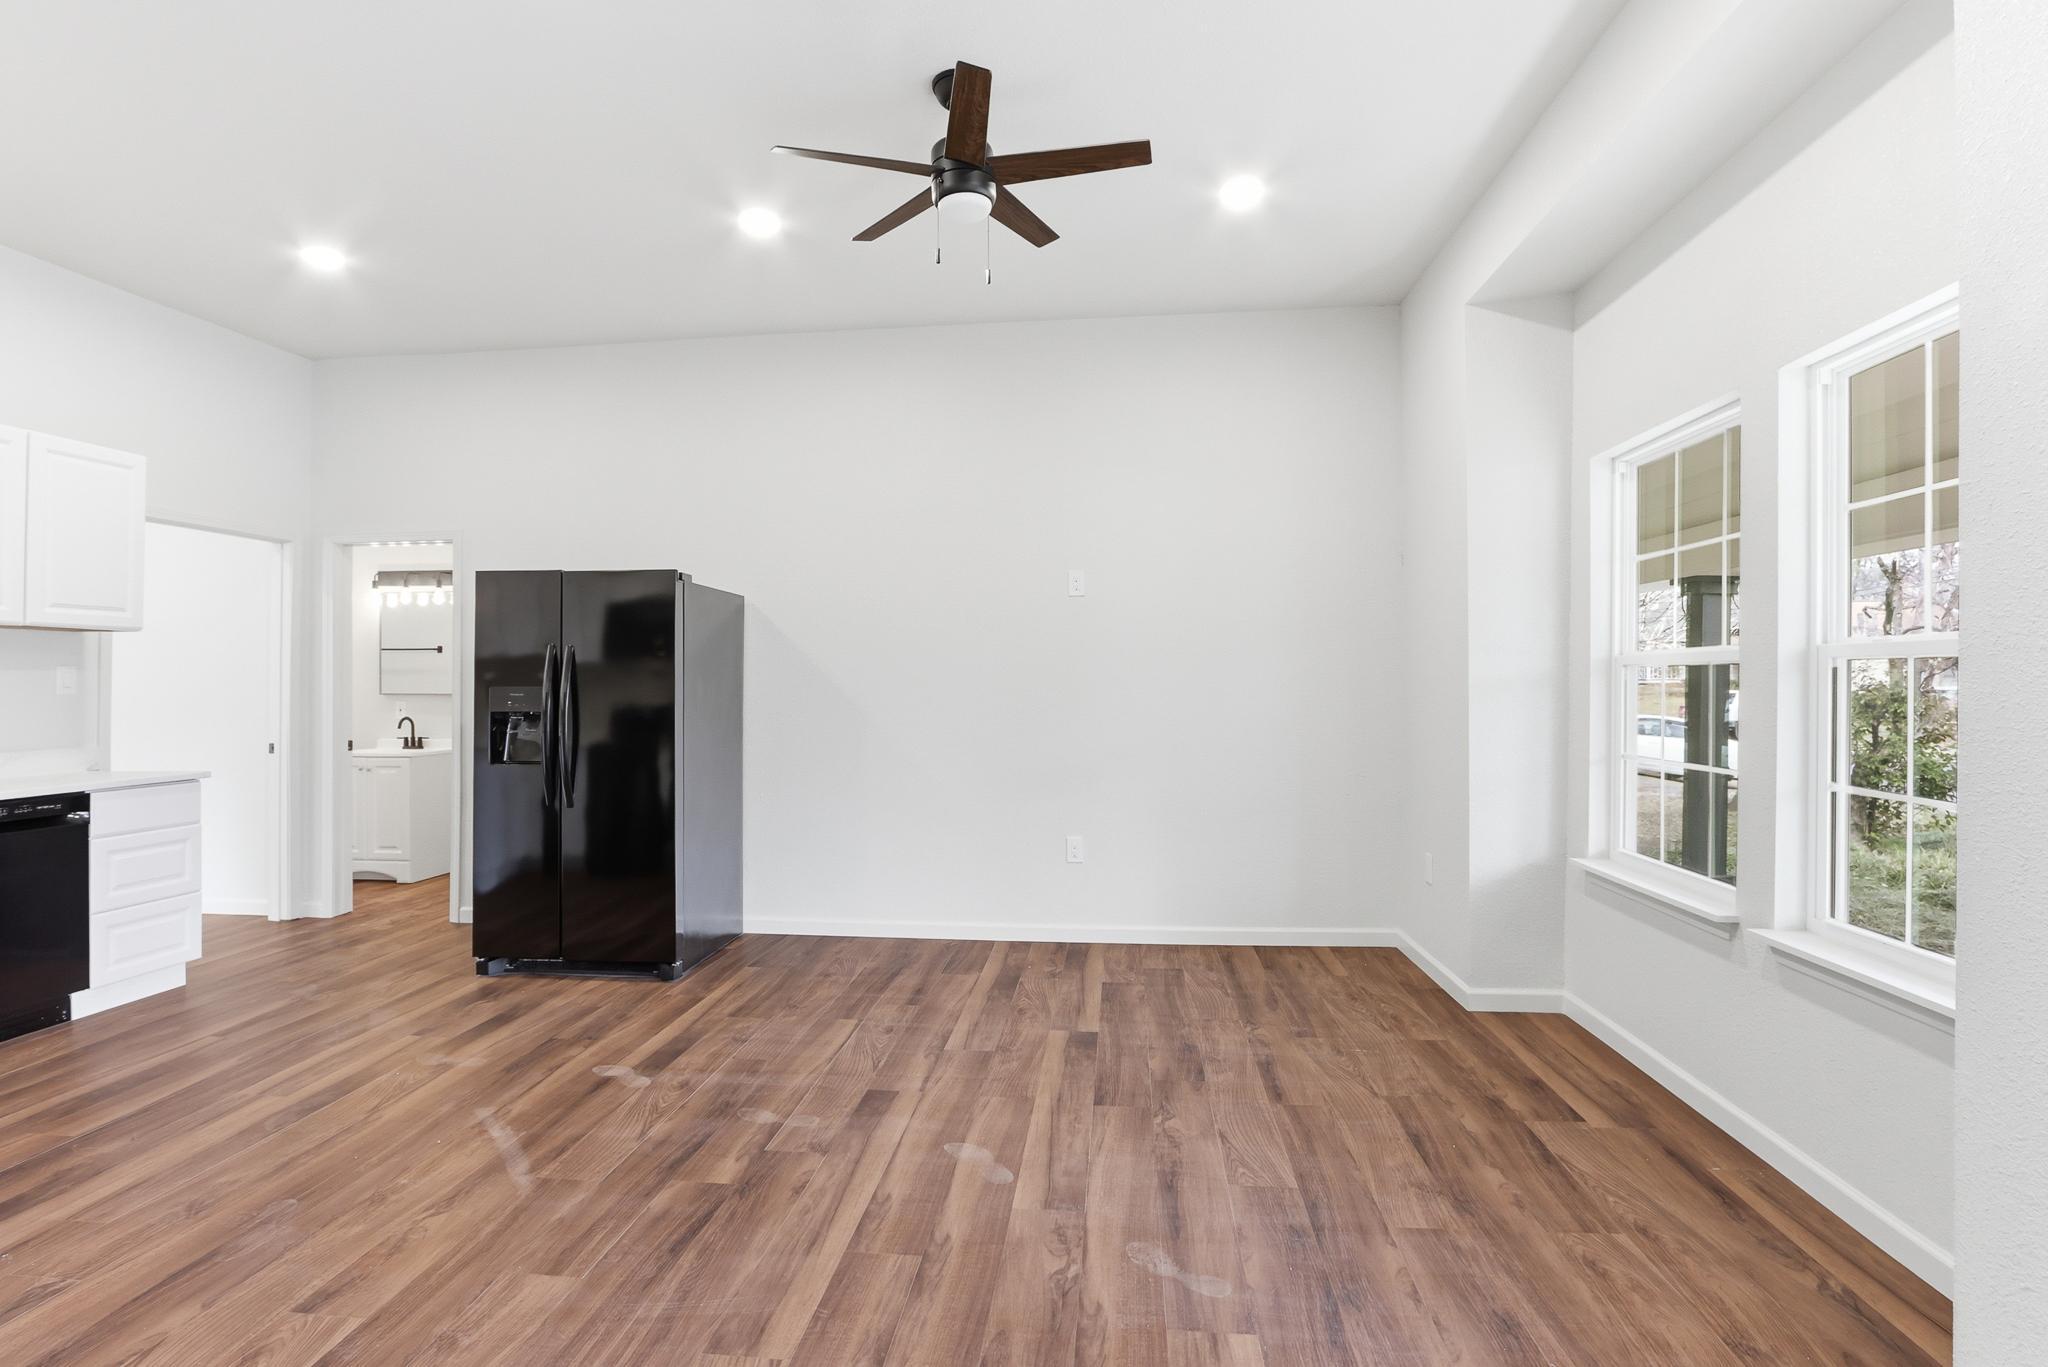
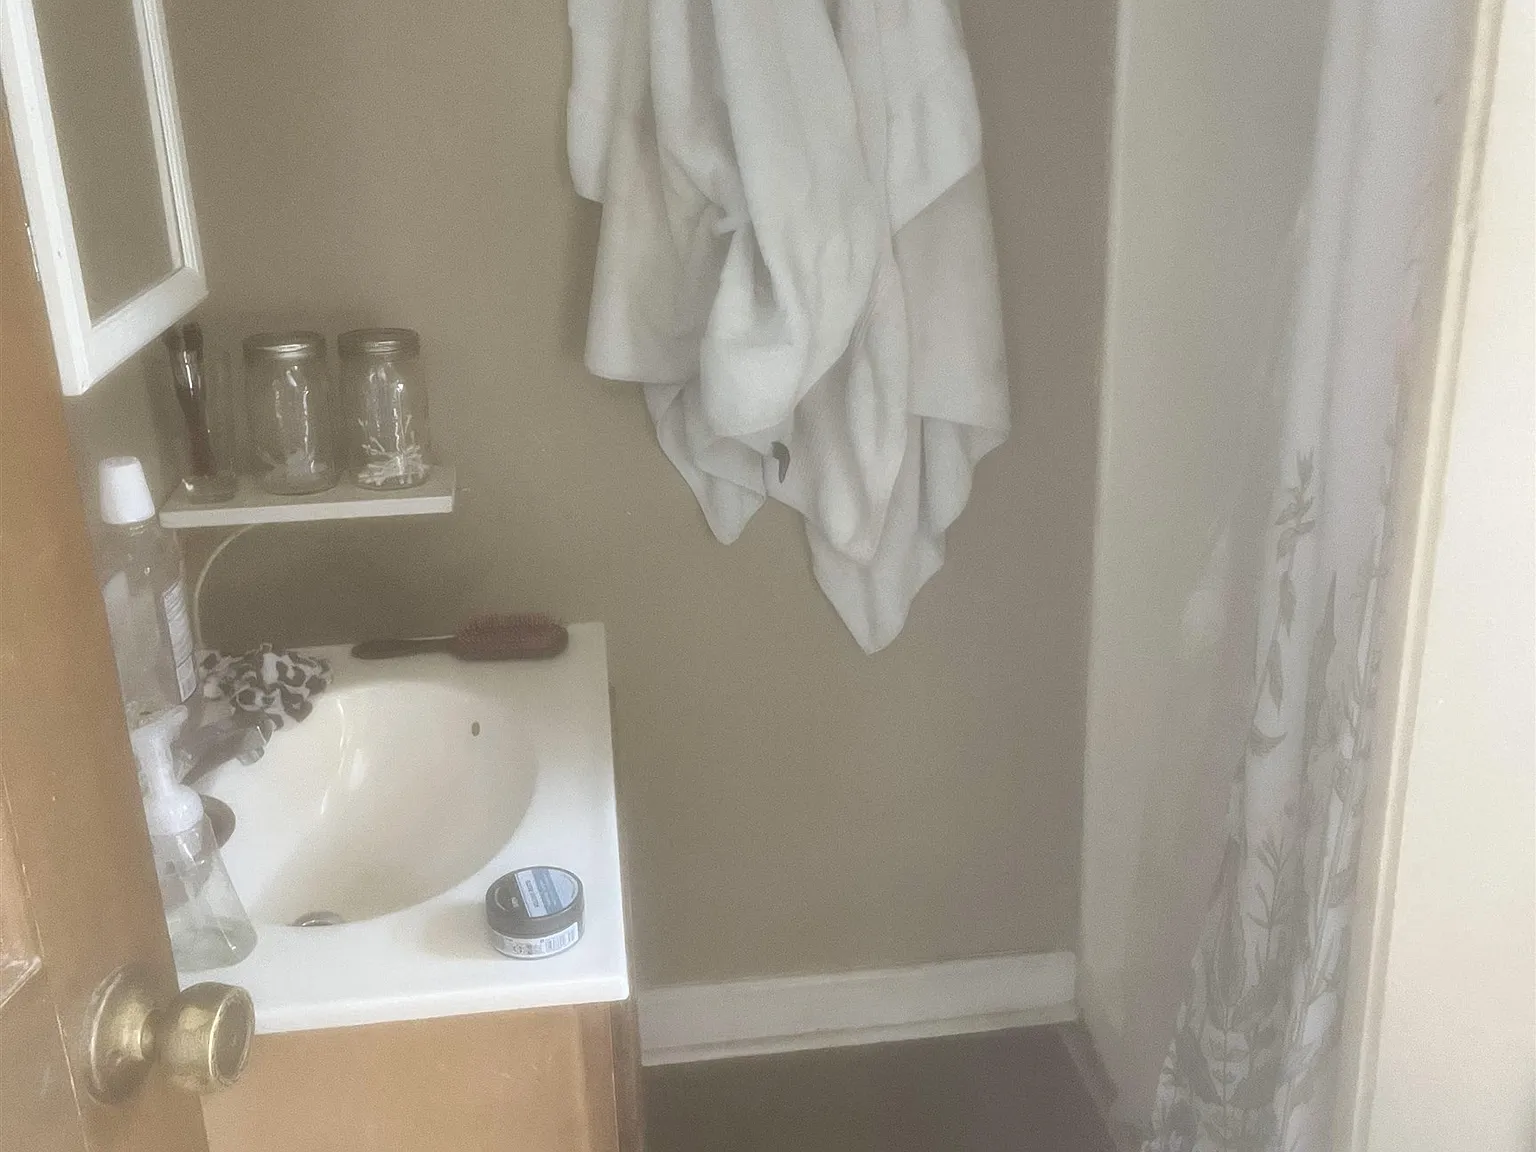
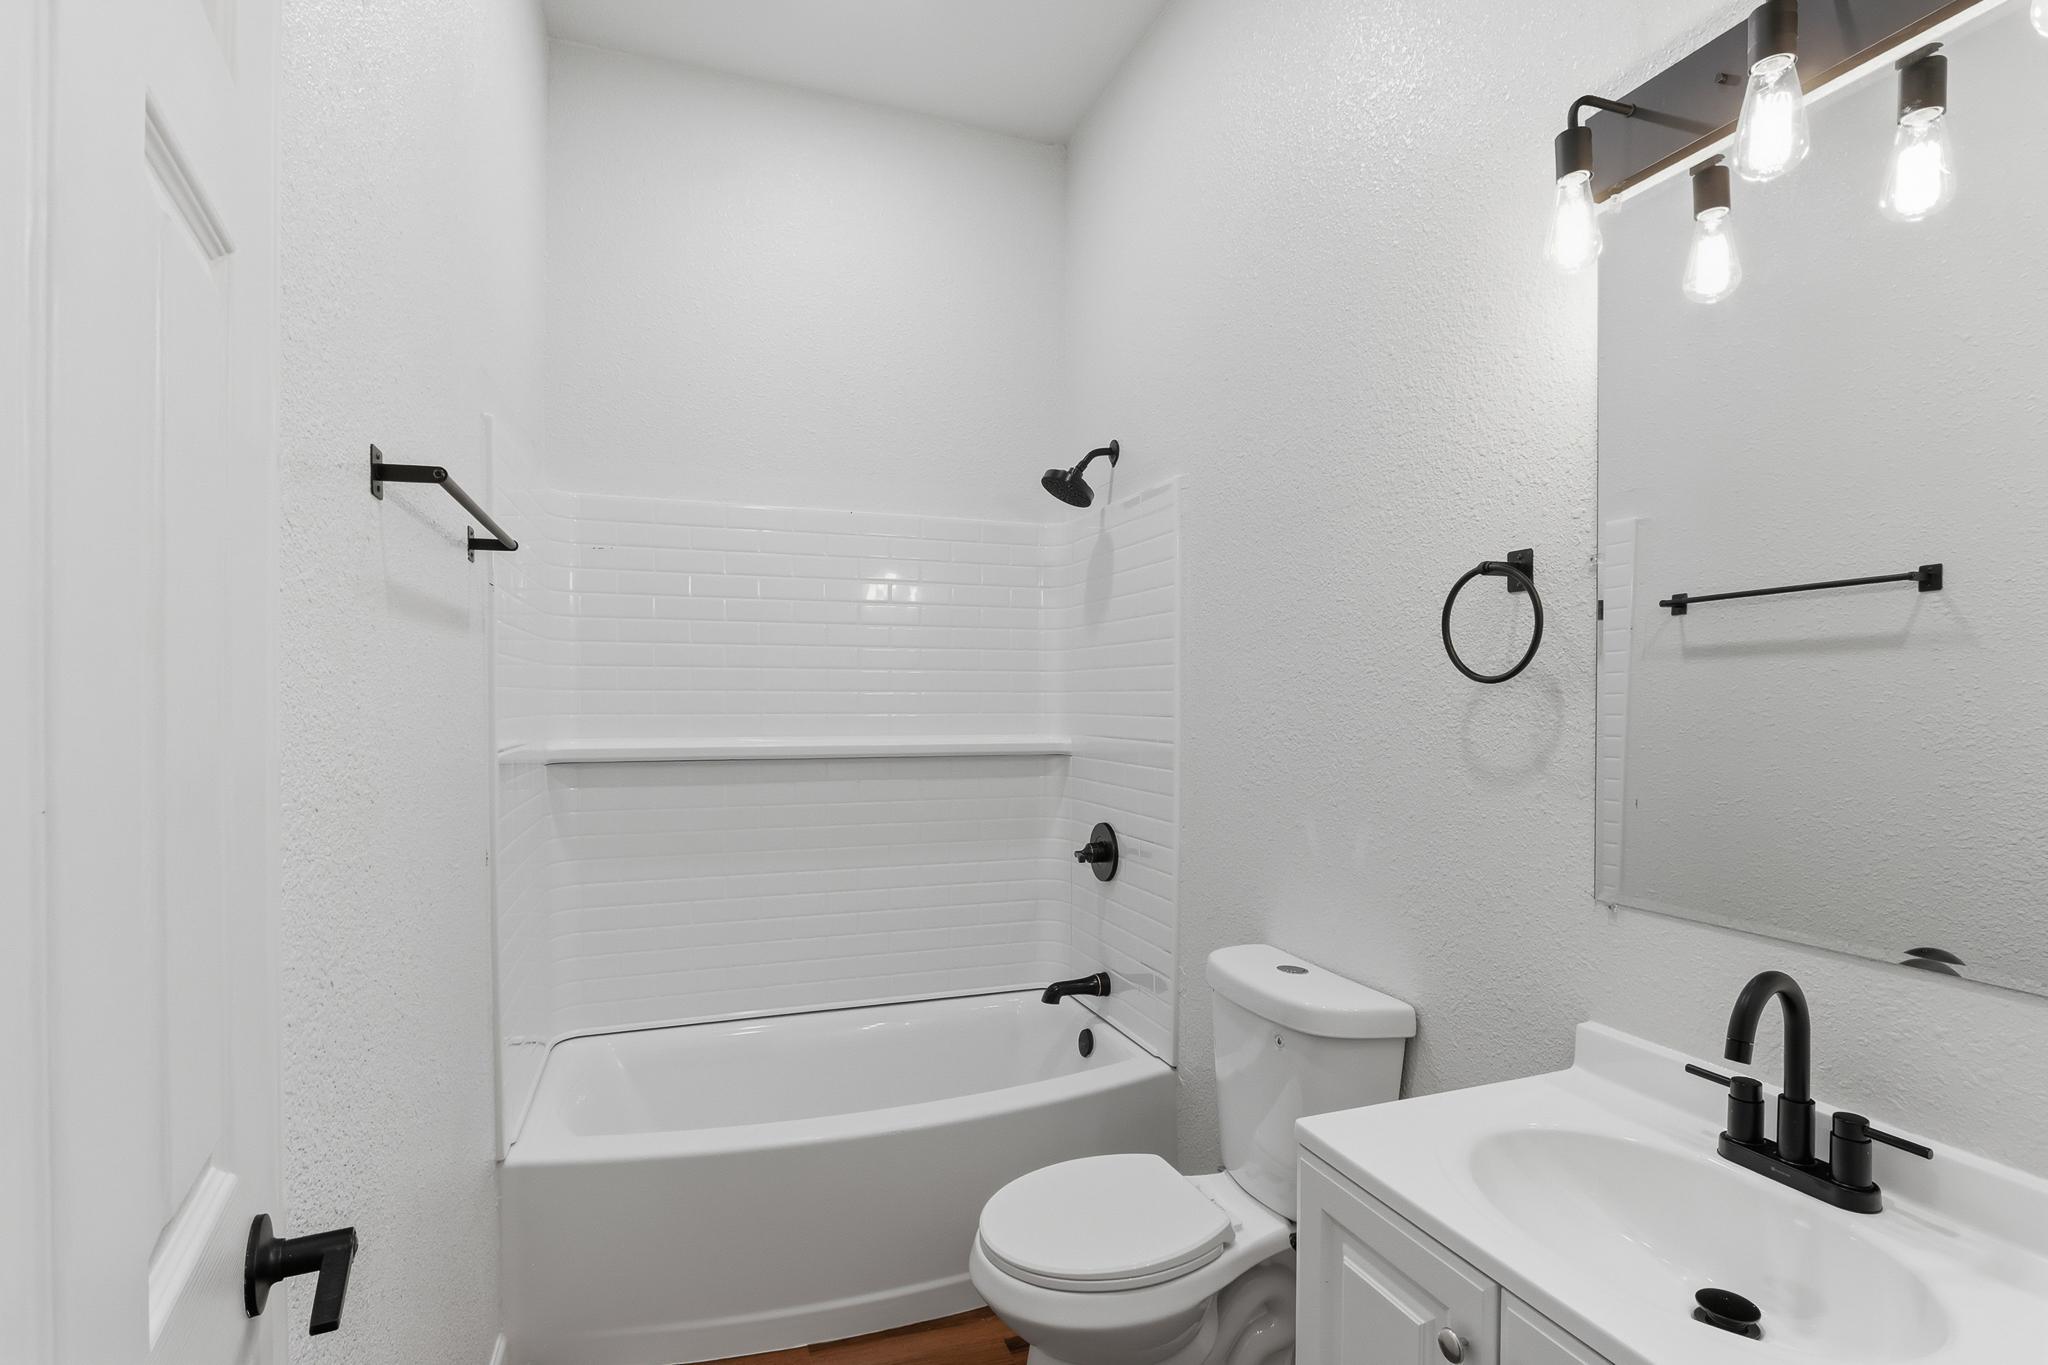
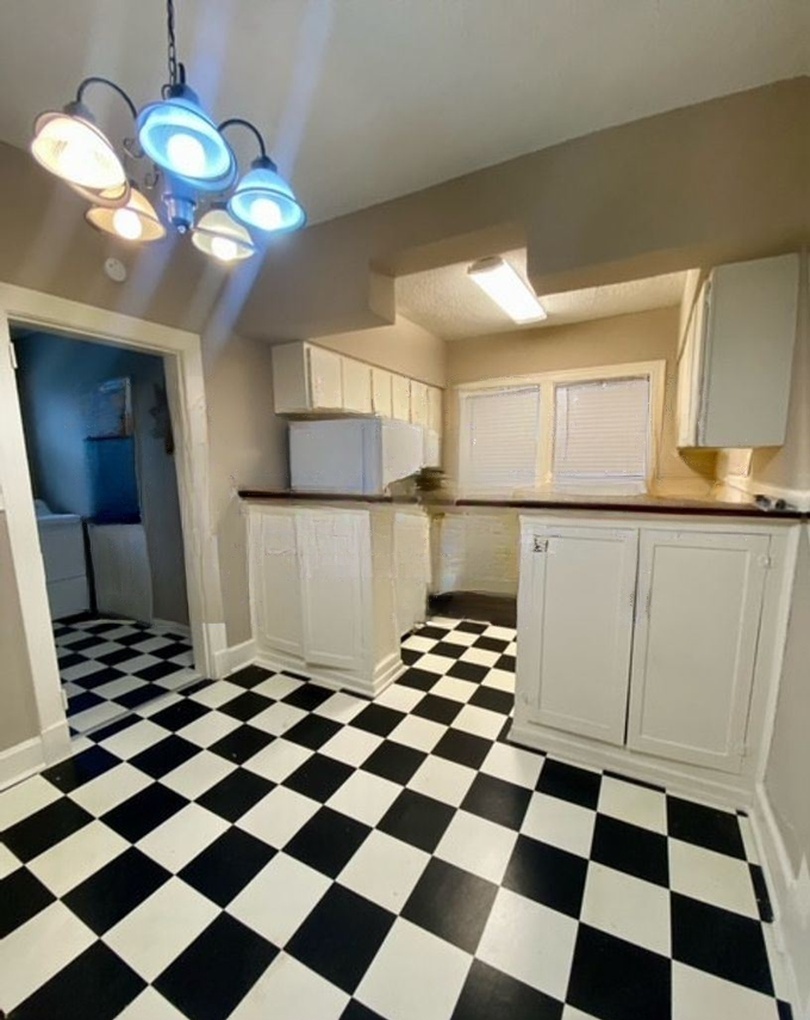
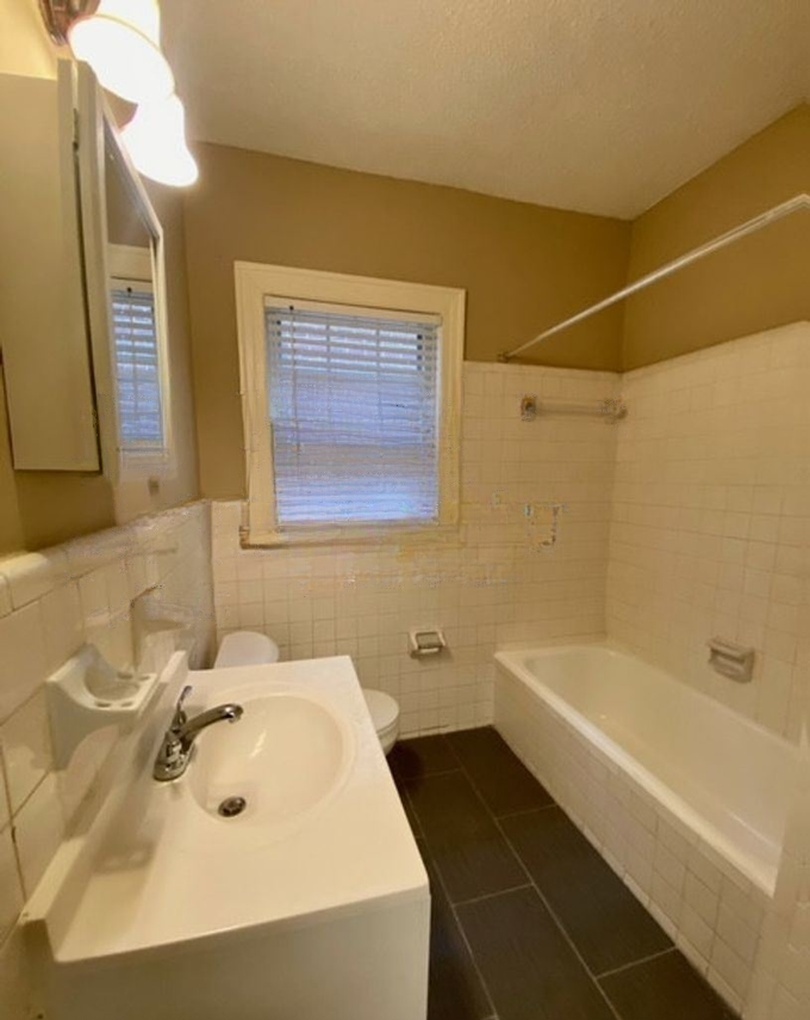
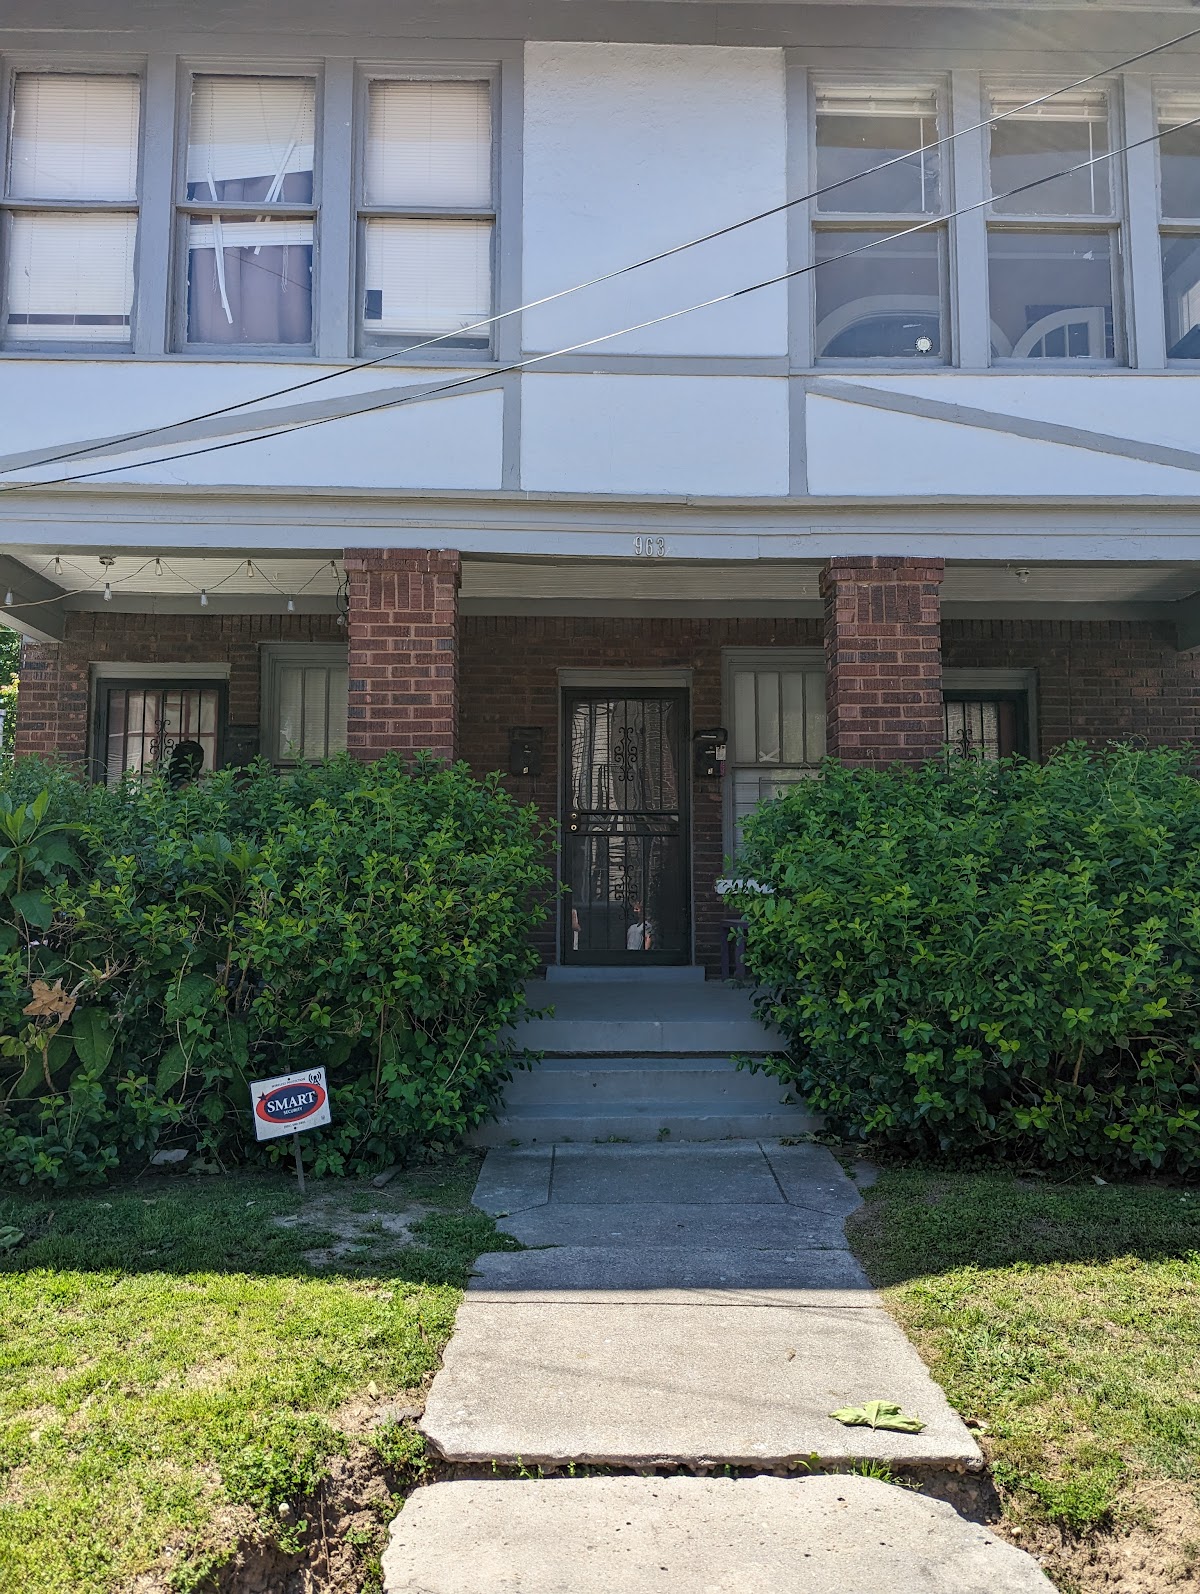
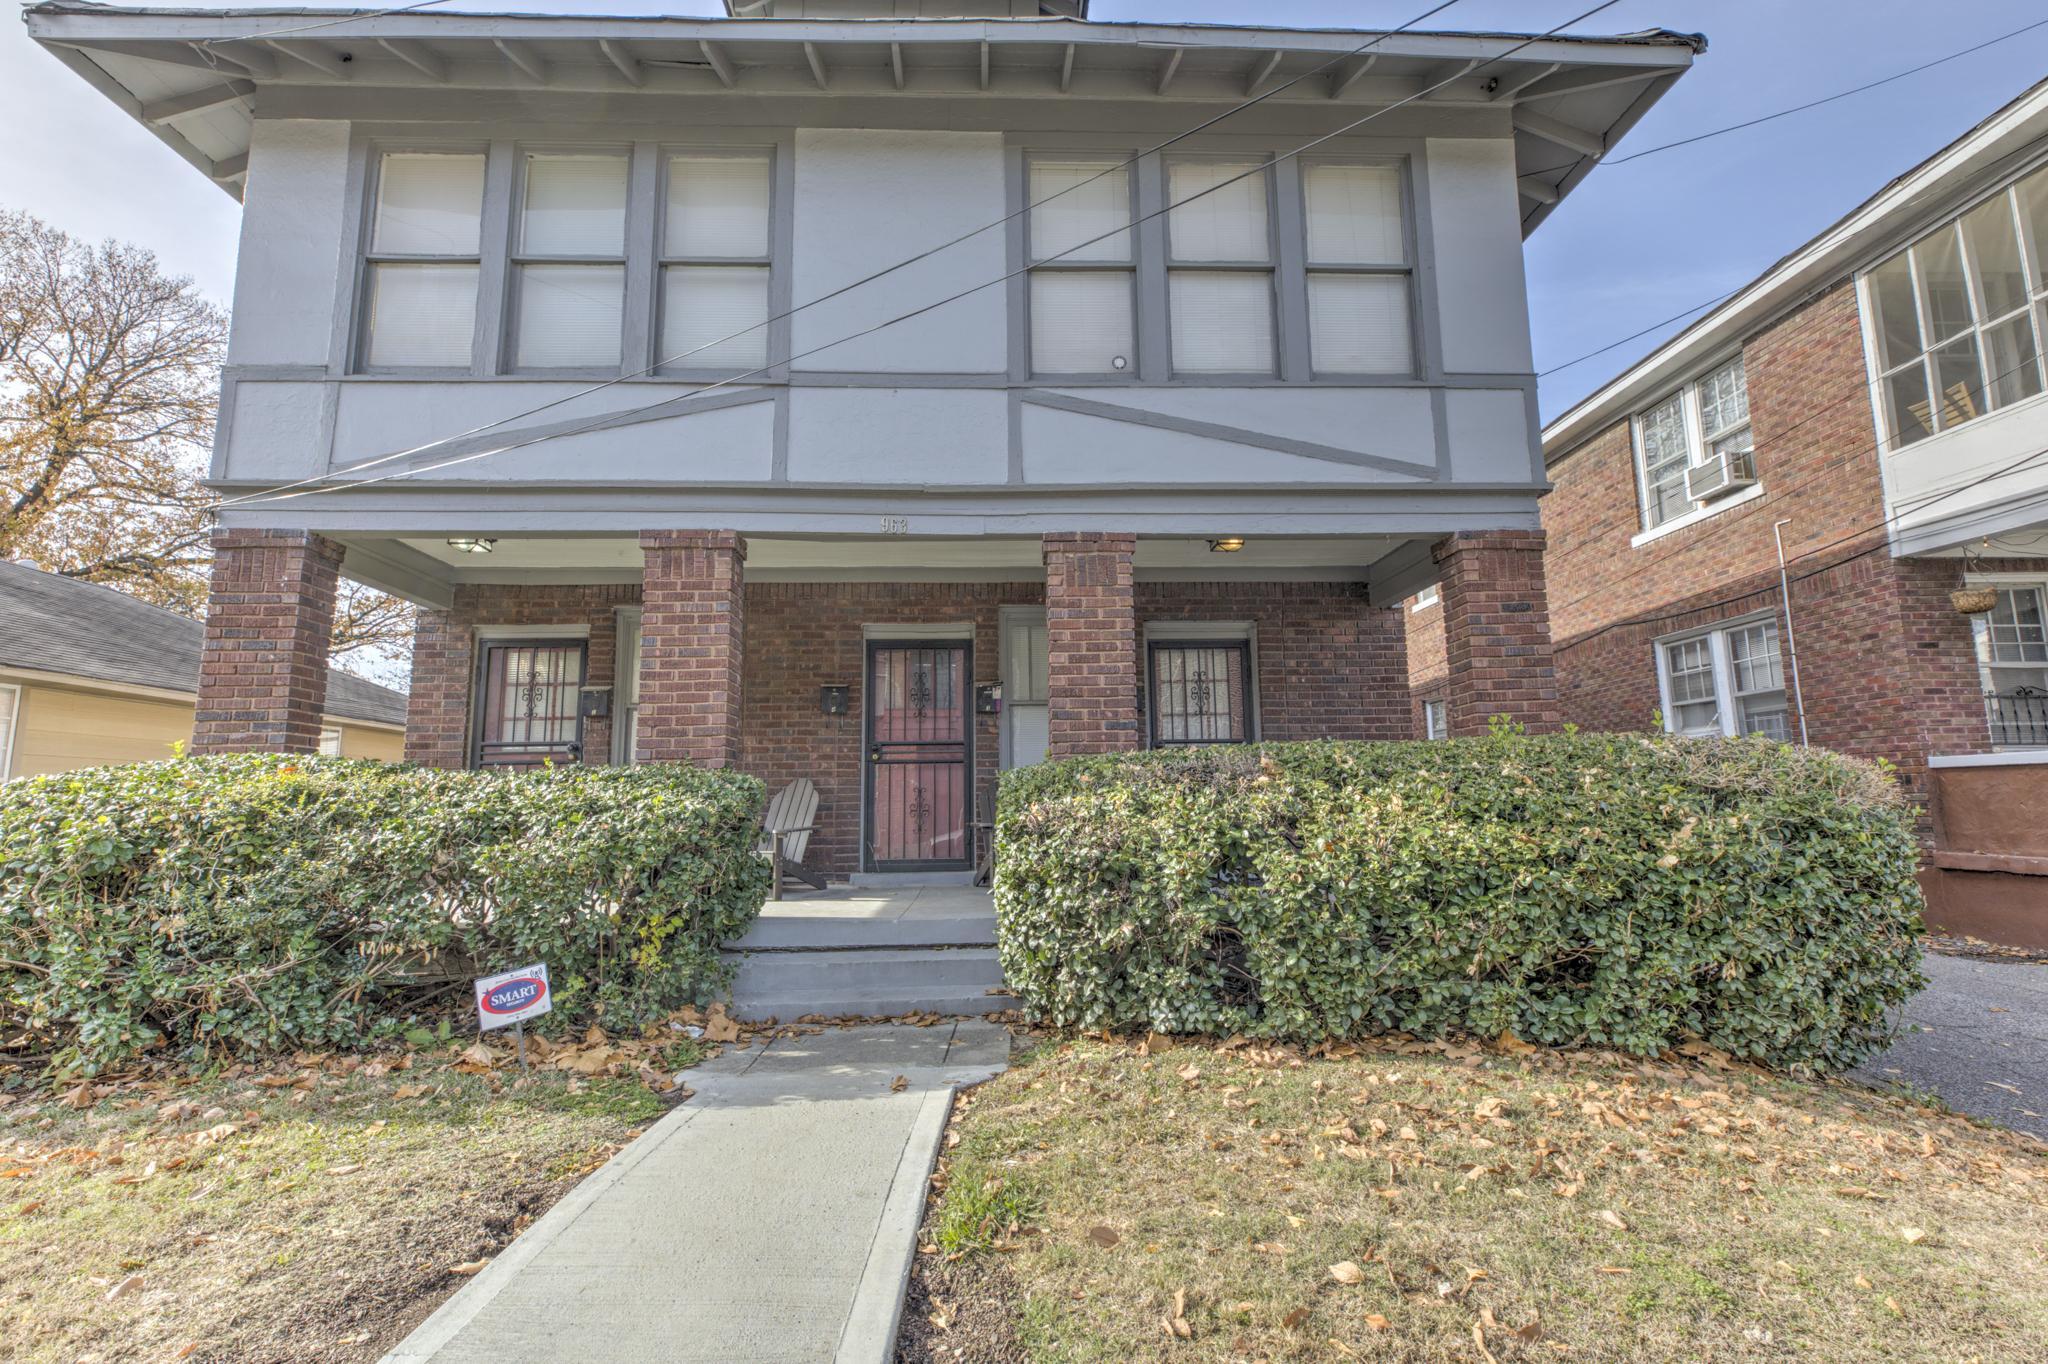
Before & After
Before 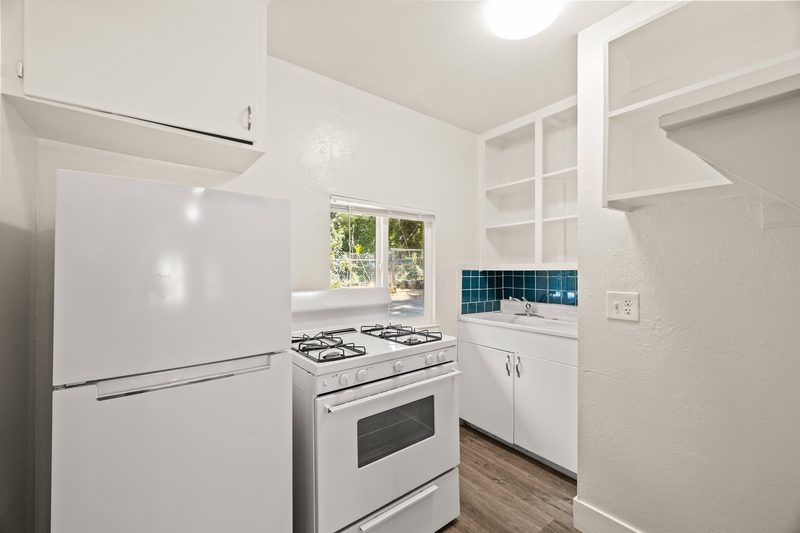
After 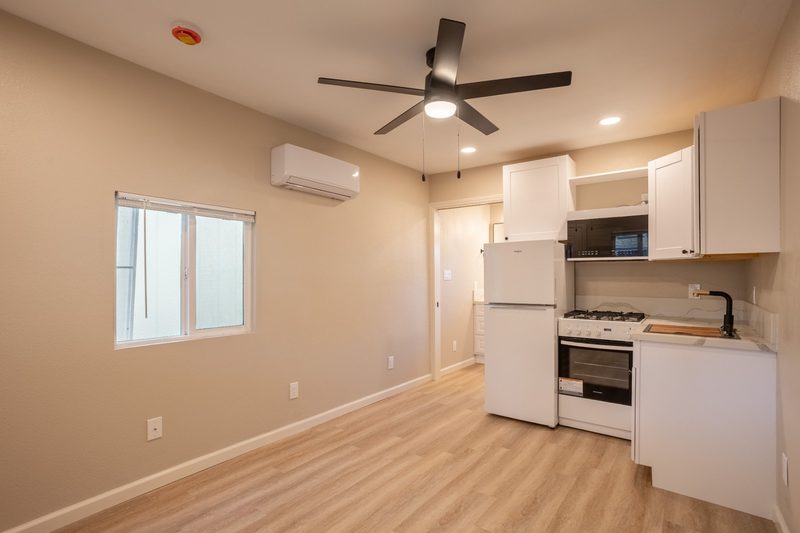
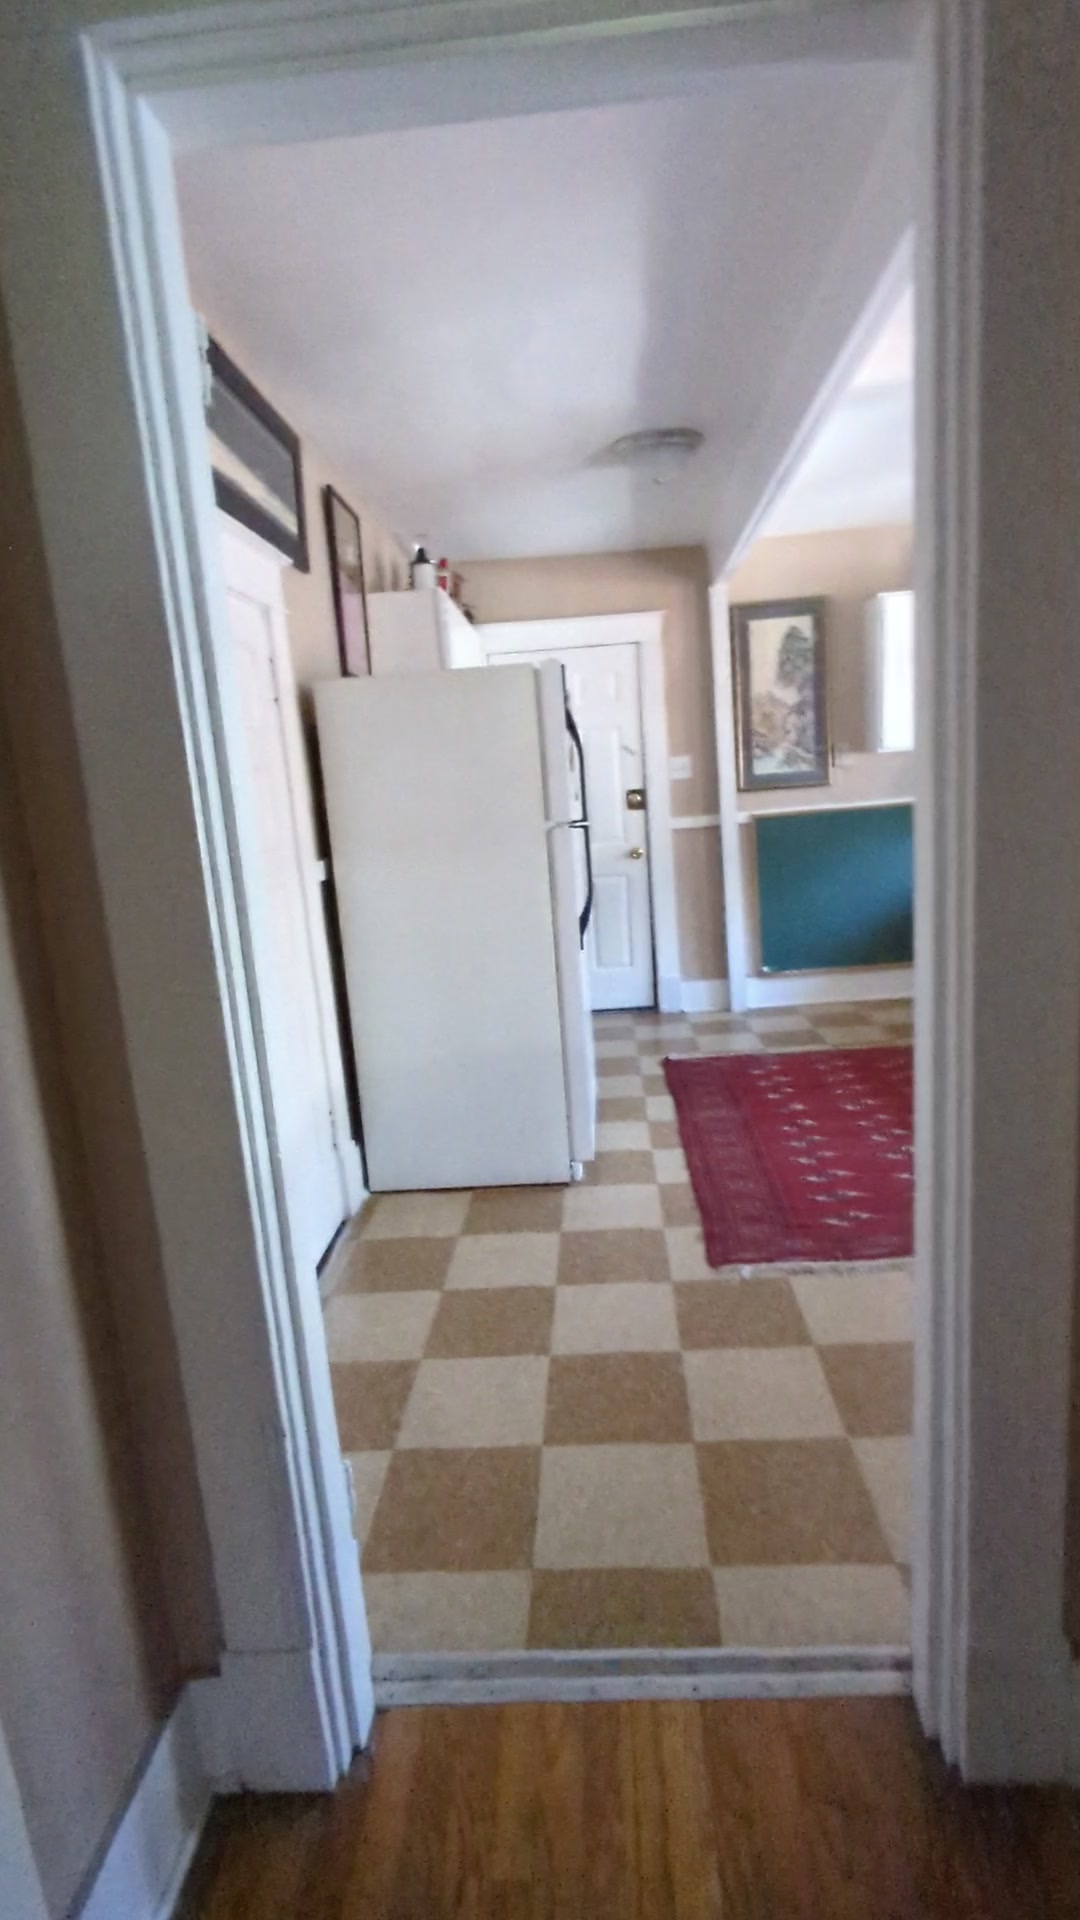
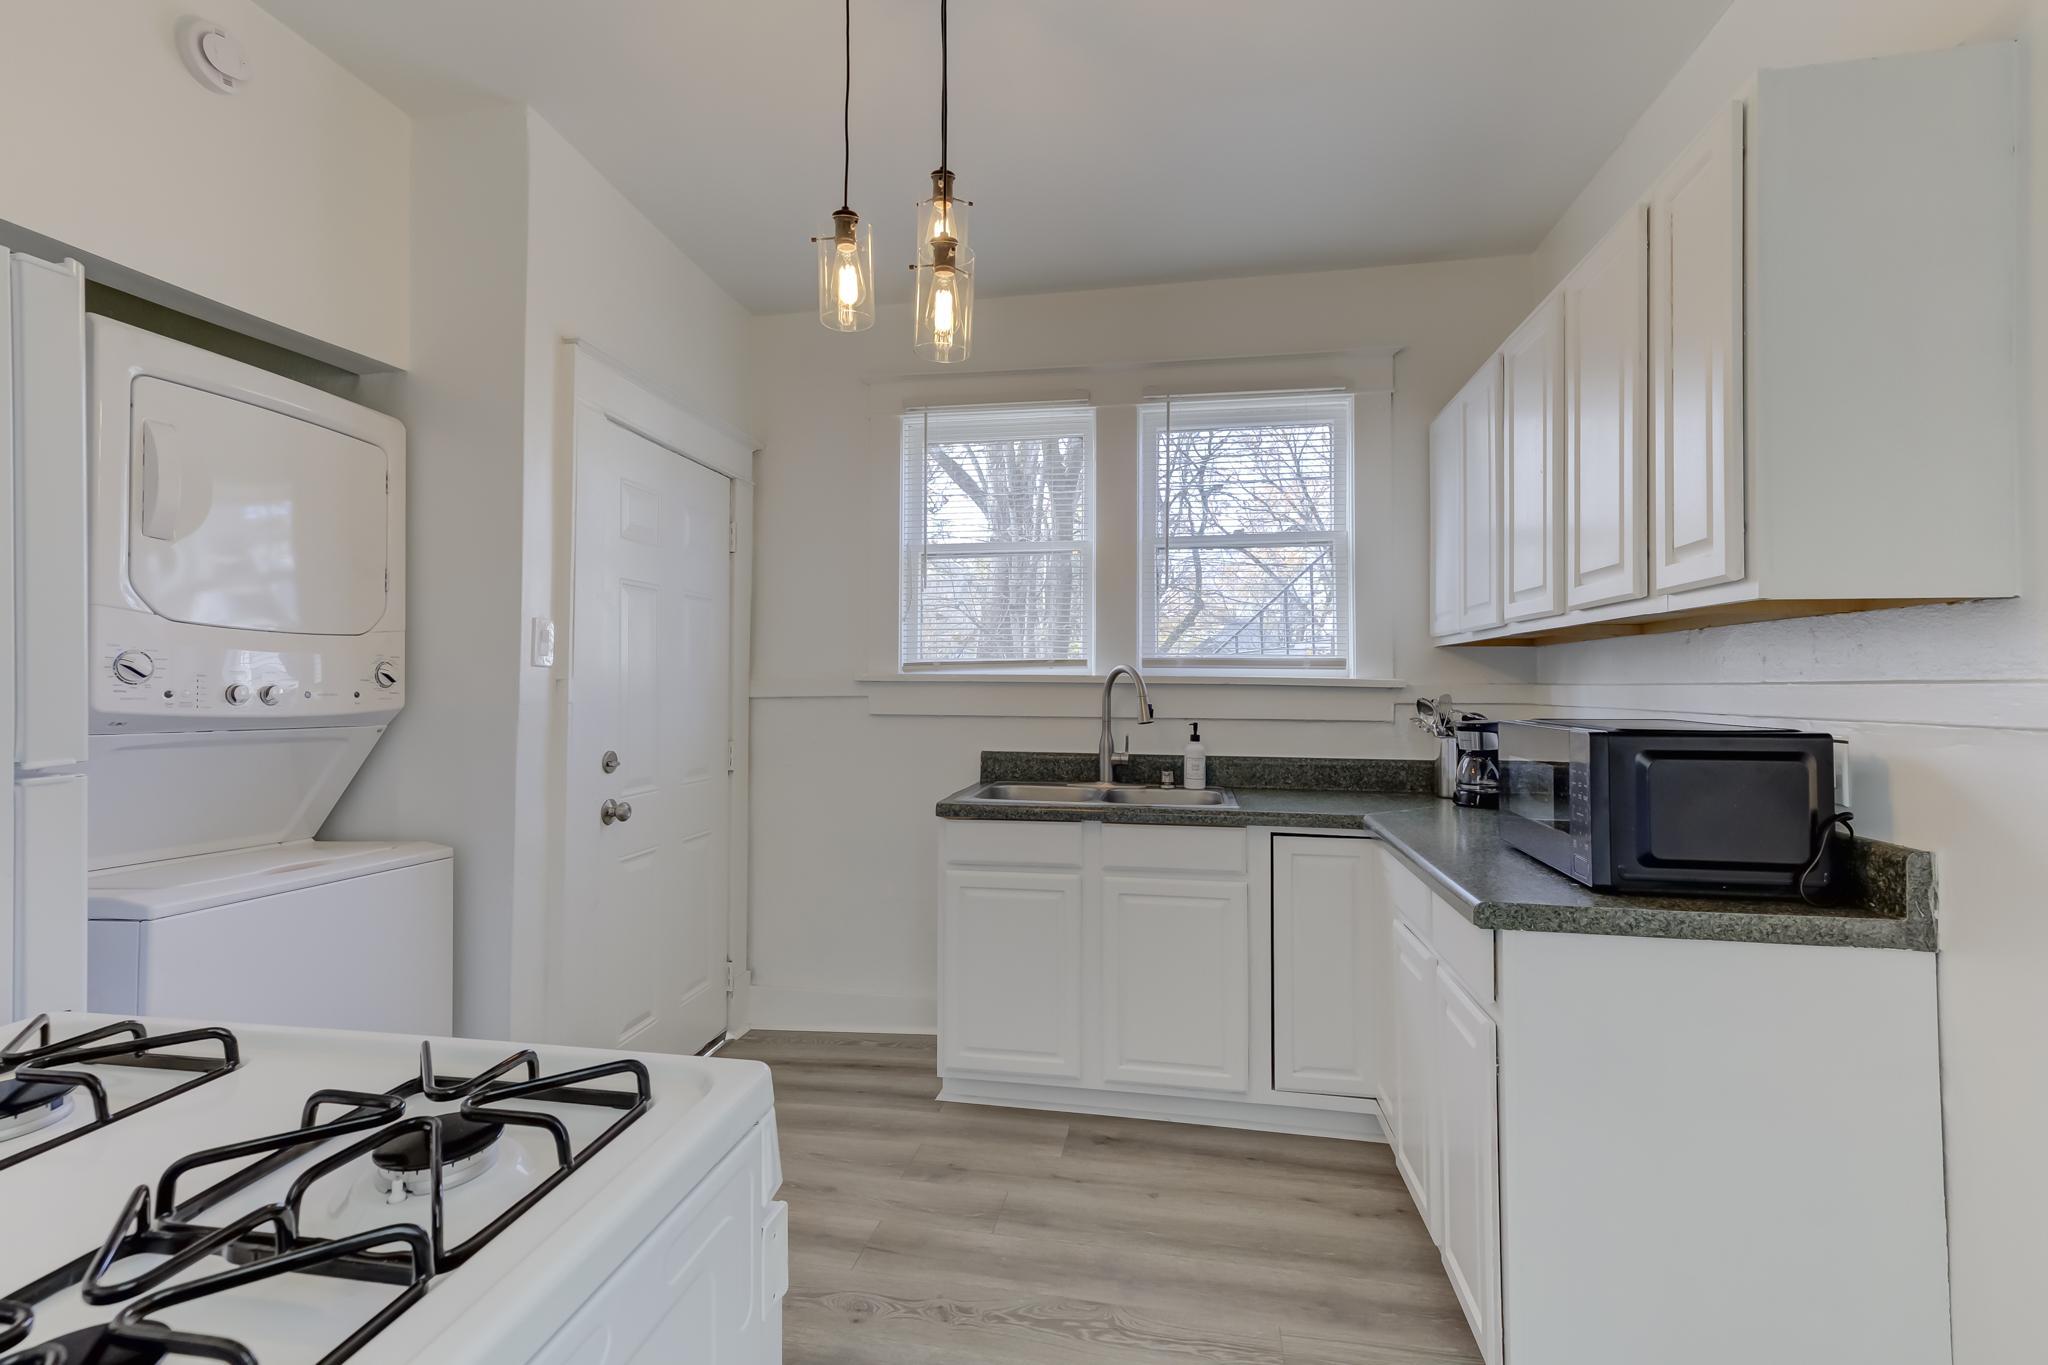
Before 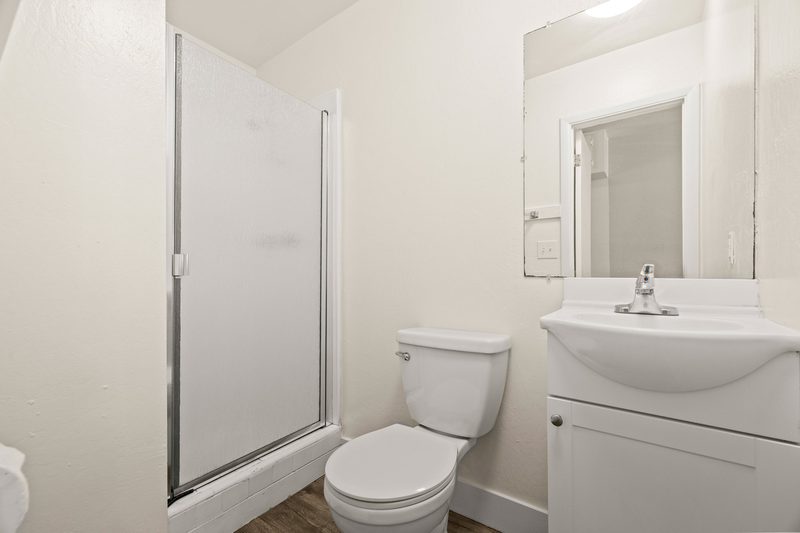
After